Reports of Slow Delivery Almost Doubled in Bulgaria. What Does the Second Trip Cost?

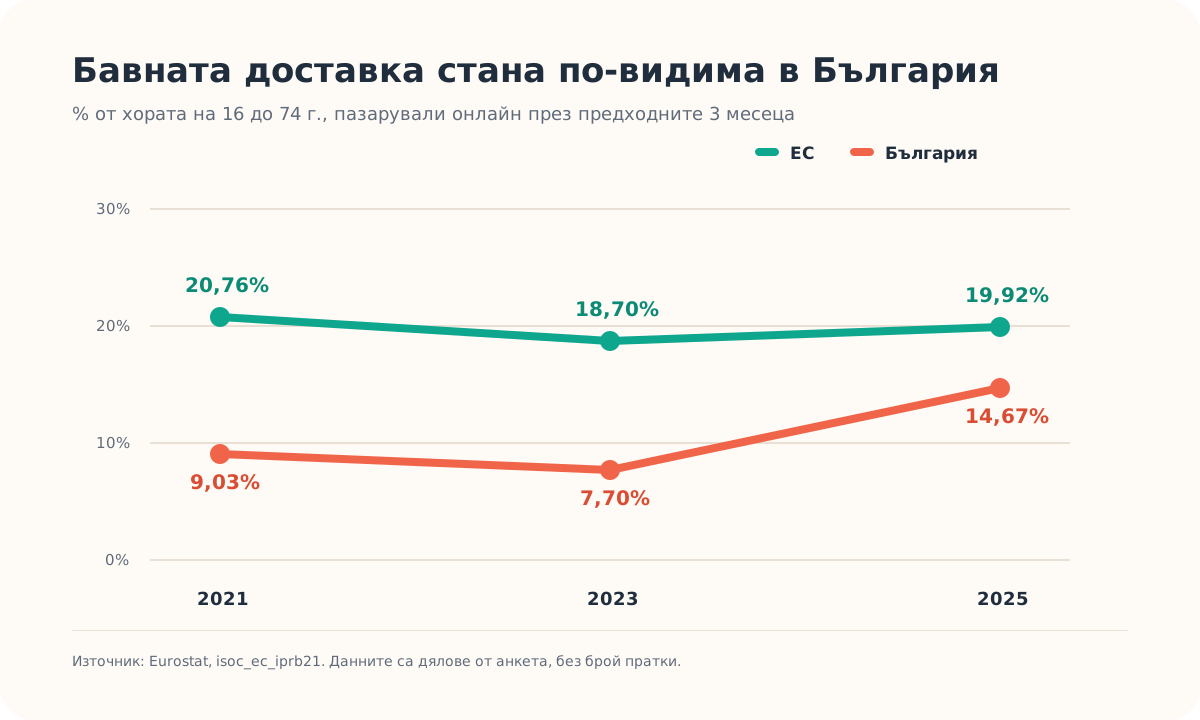
In 2025, 14.67% of recent online shoppers in Bulgaria said delivery was slower than indicated. Two years earlier, the share was 7.70%. That is a rise of 6.97 percentage points, or 90.5% relative to the 2023 level.
Across the EU, slow delivery was the most frequently reported online-shopping problem, affecting 19.92% of recent online shoppers. For a small delivery business, the figure is a warning light. A late stop can require calls, changes to tomorrow's plan, or a second journey that earns no second delivery fee.
Bulgaria closed half the gap with the EU in two years
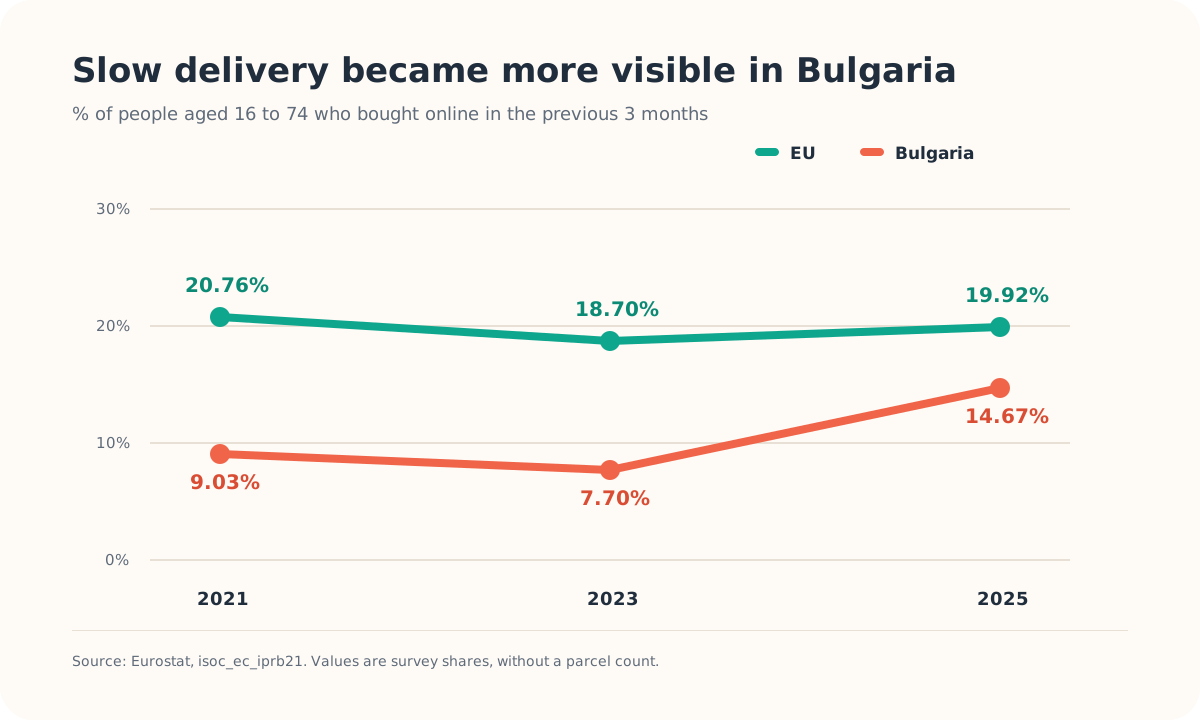
Bulgaria's reported share sat 11.00 percentage points below the EU rate in 2023. By 2025, the difference had narrowed to 5.25 points. Bulgaria still remained below the EU average, while the local change was much sharper.
| Survey year | Bulgaria | EU | Bulgaria versus EU |
|---|---|---|---|
| 2021 | 9.03% | 20.76% | -11.73 pts |
| 2023 | 7.70% | 18.70% | -11.00 pts |
| 2025 | 14.67% | 19.92% | -5.25 pts |
Three survey waves offer a narrow time series. The latest wave shows slow delivery becoming a much more visible complaint among Bulgarian respondents.
CEE spans from 7.76% to 31.40%
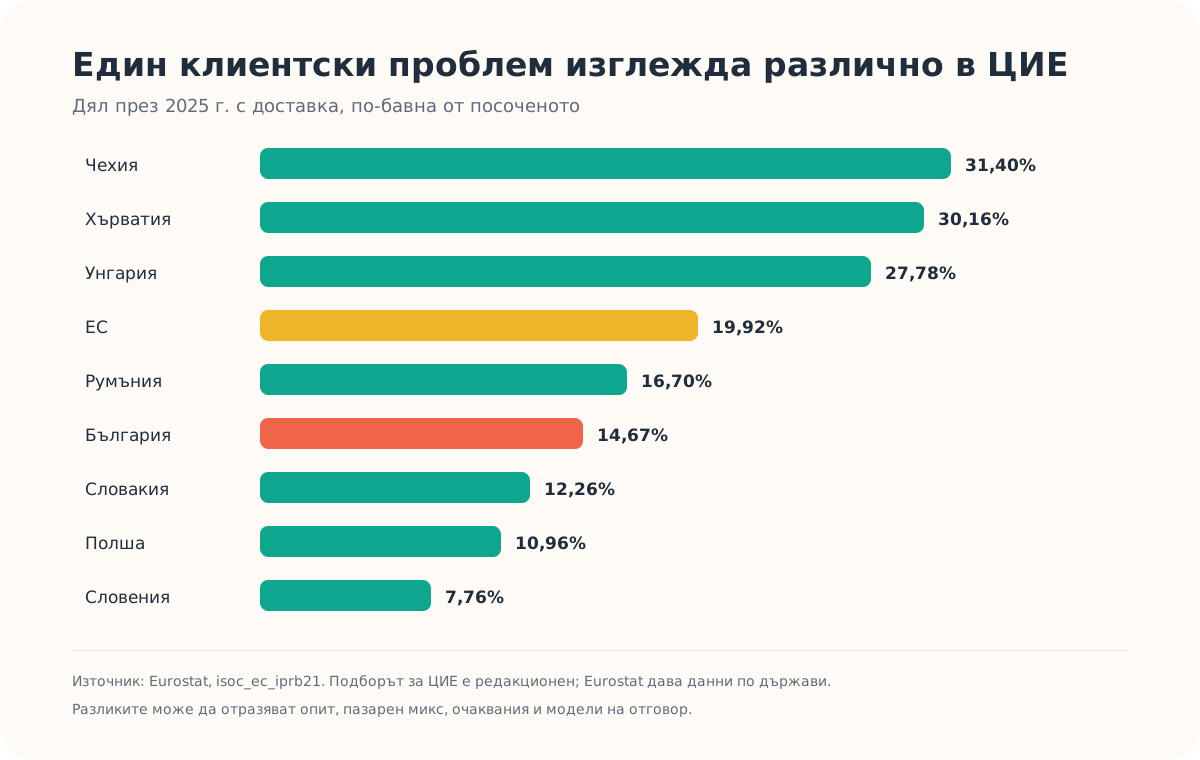
In an editorial selection of eight Central and Eastern European EU countries, Czechia reported the highest 2025 share at 31.40%, followed by Croatia at 30.16% and Hungary at 27.78%. Bulgaria's 14.67% sat below Romania and above Slovakia, Poland and Slovenia.
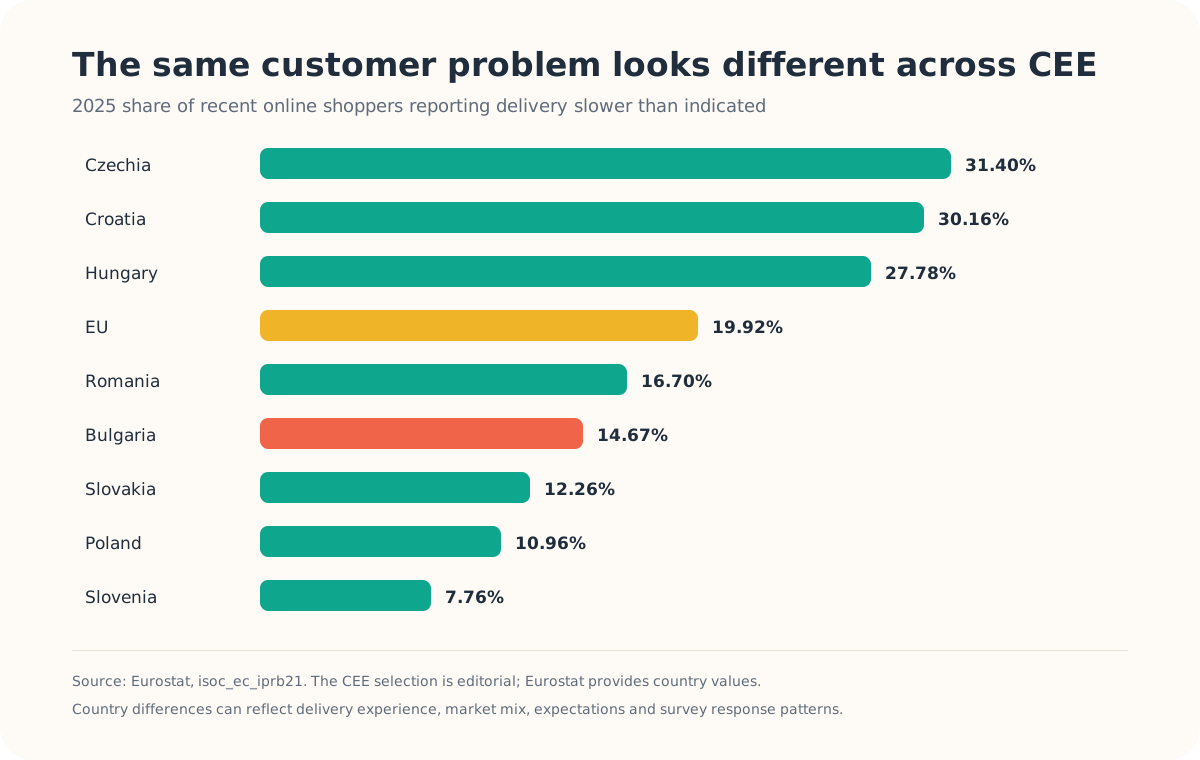
A country comparison cannot tell an owner why a particular route ran late. That answer lives in the company's own dispatch record. Useful reason codes include late departure, loading delay, wrong address, access problem, customer unavailable, traffic, service overrun, capacity and vehicle issue.
One extra kilometre costs €0.18738 in diesel today
The latest European Commission Weekly Oil Bulletin available on the review date was released on 15 October. Its tax-inclusive observation for Bulgaria on 12 October reports automotive diesel at €1.8738 per litre.
fuel per km = €1.8738 × 10.0 l/100 km ÷ 100 = €0.18738
This is the direct fuel value of one extra kilometre for an illustrative van consuming 10.0 l/100 km. Company invoices and measured vehicle consumption should replace both inputs for an operating decision.
An 18 km repeat trip adds €3.37 in direct fuel
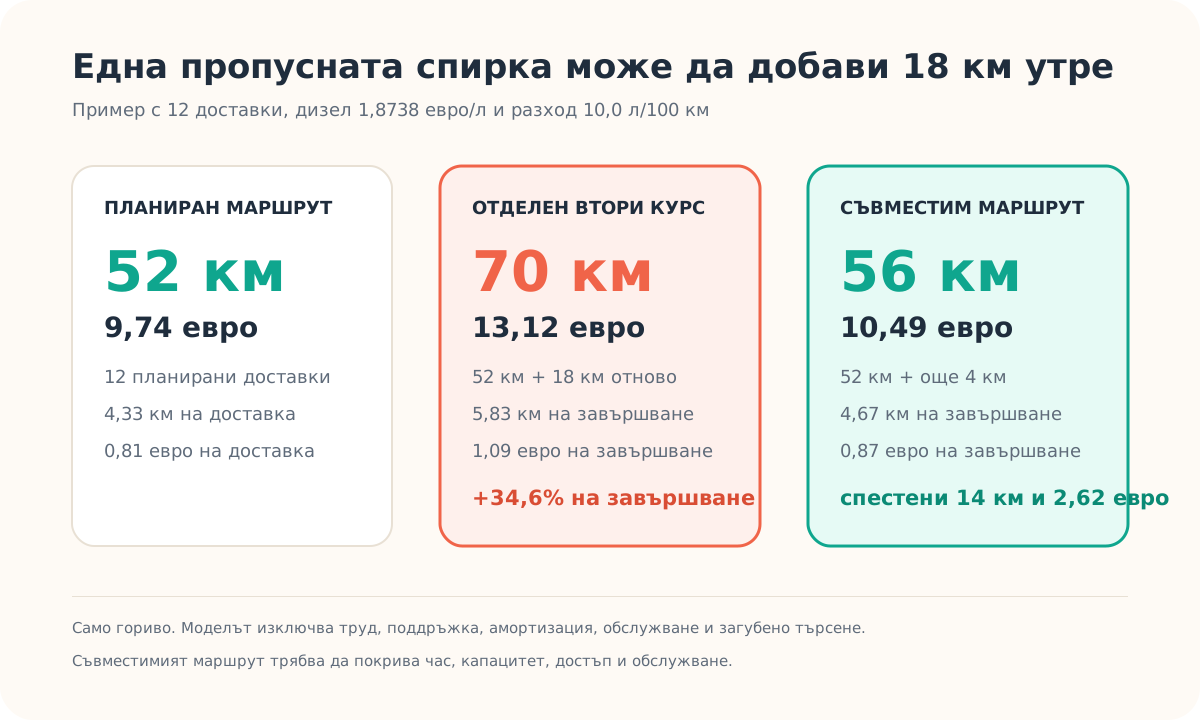
Consider a fictional 52 km route with 12 planned deliveries. The van drives the route, but one stop remains incomplete. The next morning, a dedicated depot-stop-depot journey adds 18 km before the order can be closed.
The original route uses €9.74 of diesel. The repeat adds €3.37, taking the two journeys to 70 km and €13.12. Distance per completed delivery rises from 4.33 km to 5.83 km. Direct fuel per completion rises from €0.81 to €1.09, a 34.6% increase.
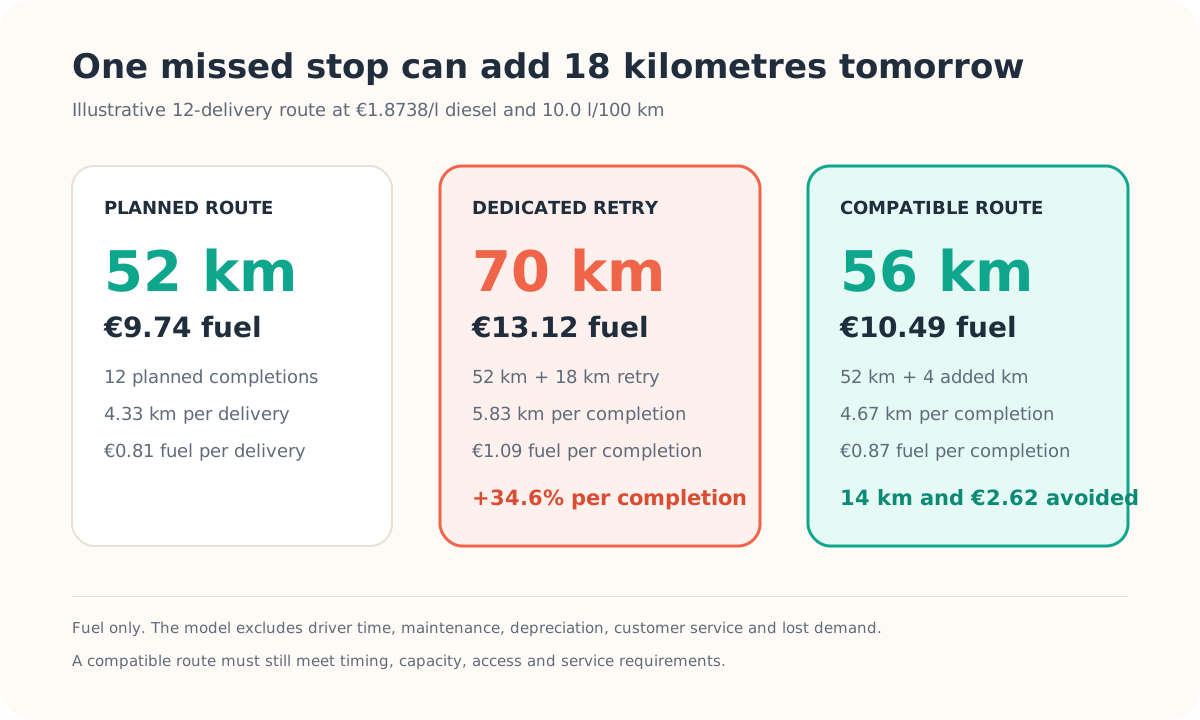
The driver's 18 km also consume time. At an illustrative average of 30 km/h, driving alone takes 36 minutes. Loading, parking, handover and customer communication sit on top. Maintenance, depreciation, financing and lost capacity require company records before they can be priced responsibly.
A compatible route can contain the repeat to 4 km
Now assume tomorrow already has a route passing near the incomplete stop. A two-kilometre movement off that path and two kilometres back add 4 km. Timing, vehicle capacity, product handling and customer access all still fit.
The added fuel falls to €0.75. Compared with the dedicated retry, the plan avoids 14 km and €2.62 in direct diesel. For the original 12-order cohort, attributable distance becomes 56 km and fuel becomes €10.49. The cost per completion is €0.87.
This is where route density earns its place in the cost structure. More deliveries on one route help when they share travel and remain operationally compatible. A nearby address with a conflicting time promise can still create a detour or delay.
Build a repeat-kilometre ledger before changing the promise
A two-week spreadsheet is enough to reveal where delays become cost. Track the following fields for two comparable weeks:
- Record the promised and actual service time. Keep departure, arrival, service and completion timestamps.
- Use one primary reason code. Separate routing causes from address quality, customer availability, loading, traffic and vehicle events.
- Measure the repeat movement. Record added kilometres, added drive minutes and added service minutes.
- Price the direct fuel. Multiply repeat kilometres by the vehicle's measured litres per 100 km and the invoice fuel price.
- Watch the denominator. Calculate kilometres and fuel per completed delivery, including the work required to close yesterday's stop.
- Review patterns by zone and promise. Look for areas, weekdays, customers or time bands that repeatedly break route flow.
Five dedicated repeats like the model add 90 km and €16.86 in fuel. Twenty-two add 396 km and €74.20. These extensions assume the same distance, consumption and price each time. Their purpose is to make the exposure visible before labour and vehicle cost are added.
What the owner can change before the van leaves
- Validate the stop. Confirm address, phone, entrance, floor, parking, opening hours and recipient availability.
- Group compatible promises. Keep nearby stops together when their time, capacity and handling requirements fit the same vehicle.
- Protect departure time. Finish picking, loading and paperwork before the route's planned start.
- Place risky stops deliberately. Use customer knowledge to review stops with narrow access, uncertain availability or long service time.
- Prepare a recovery plan. Decide which existing route could absorb a repeat with the fewest added kilometres.
- Compare plan with reality. Review planned distance, actual distance, completed stops and repeat kilometres every week.
Where MileCut fits
MileCut starts with the address list the business already uses. Upload Excel or CSV, choose one to five couriers, and review the proposed allocation and stop order on the map. Team and Control allow the planner to move stops between couriers and reorder them before creating routes.
That review can keep compatible stops together, expose a remote repeat before it becomes a dedicated trip, and show planned kilometres for each courier. Each courier then receives a separate Google Maps link.
MileCut's current scope covers address import, allocation, route review, manual reordering and Google Maps links. Keep customer messaging, proof of delivery, live vehicle tracking and time-window enforcement in the company's existing workflow, then use those operating facts when reviewing tomorrow's address list and route order.
Sources and limits: Eurostat, more than a third of online shoppers face issues, Eurostat dataset isoc_ec_iprb21, European Commission Weekly Oil Bulletin. Sources were checked on 16 October 2026. Percentages describe survey respondents who bought online in the previous three months. CEE is an editorial selection of Bulgaria, Czechia, Croatia, Hungary, Poland, Romania, Slovakia and Slovenia. The 52 km route, 18 km repeat, 4 km compatible-route increment, speed, consumption and extensions are illustrative. Use the model as a cost scenario; observed customer results and guaranteed savings sit outside its scope.
Price the second trip before it enters tomorrow's plan.
Upload the address list, keep compatible stops together and review planned kilometres for each courier.