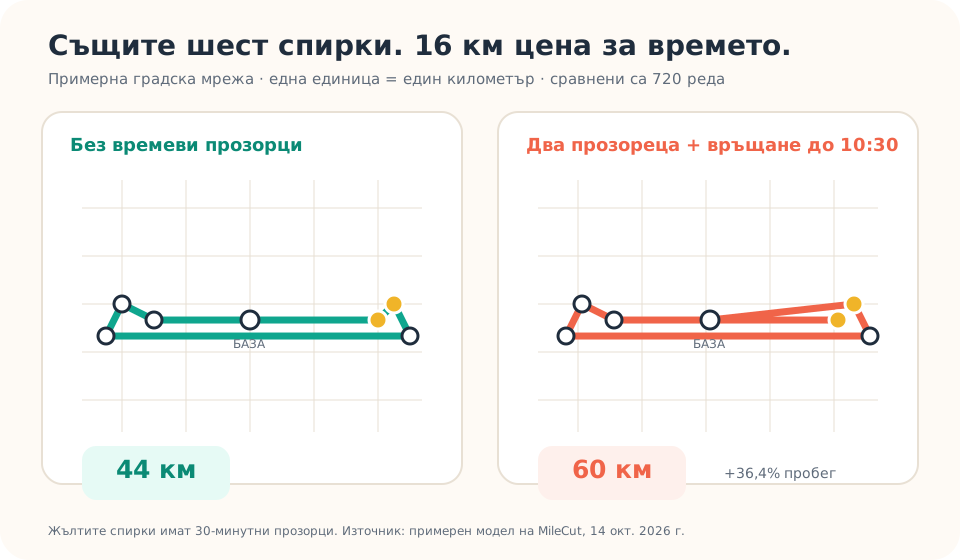
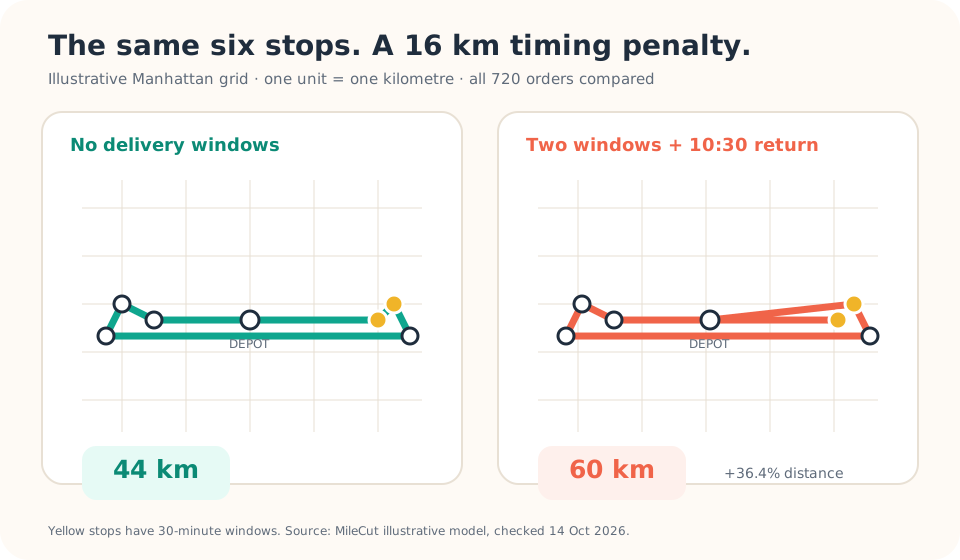
The shortest route between six delivery addresses is 44 km in this transparent city-grid model. Add one eastern stop promised between 08:15 and 08:45, another eastern stop promised between 09:45 and 10:15, and a 10:30 return deadline. The shortest feasible route becomes 60 km.
Those 16 km consume €3.03 in direct diesel at the latest Bulgarian benchmark and an illustrative 10.0 l/100 km. They also add 32 minutes to the route. A narrow delivery promise can therefore change the economics of every stop around it.
Six nearby stops fit the map. The clock changes the route.
The fictional depot sits in the centre of a rectangular street grid. Three stops lie east and three west. One grid unit equals one kilometre. Travel speed is fixed at 30 km/h, so each kilometre takes two minutes. The driver starts at 08:00 and spends five minutes at every stop.
| Model input | Value | Why it matters |
|---|---|---|
| Depot | (0, 0) | Start and return point |
| East stops | (8,0), (9,1), (10,-1) | Two carry timed promises |
| West stops | (-6,0), (-8,1), (-9,-1) | Compatible geographic group |
| Travel and service | 30 km/h + 5 min | Turns distance into a schedule |
| Windows | 08:15-08:45, 09:45-10:15 | Set allowed service starts |
| Return deadline | 10:30 | Limits waiting and detours |
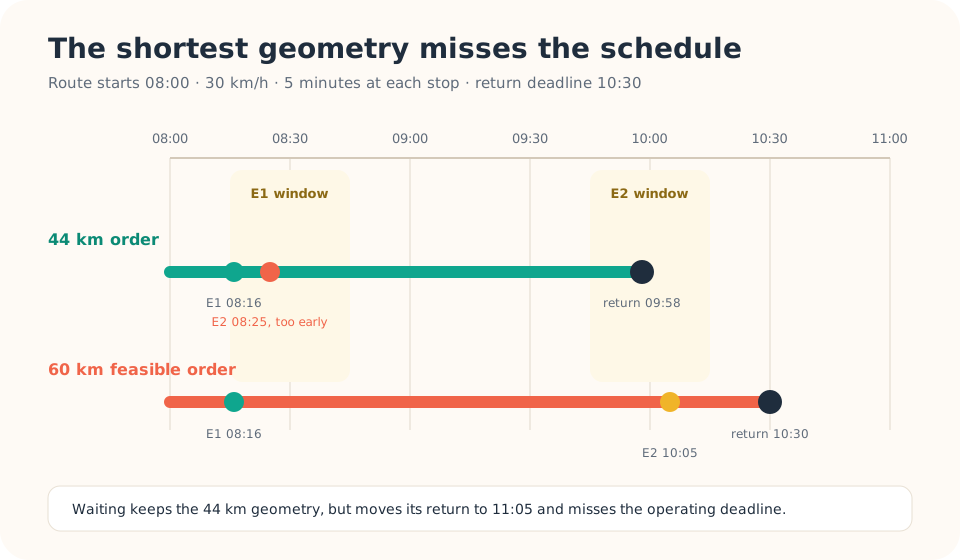
All 720 possible visit orders were evaluated. Waiting is allowed, and a visit counts as valid when service starts inside its window. Without the clock constraints, the shortest closed route is 44 km and returns at 09:58. It visits the eastern cluster, crosses once to the west, then returns to the depot.
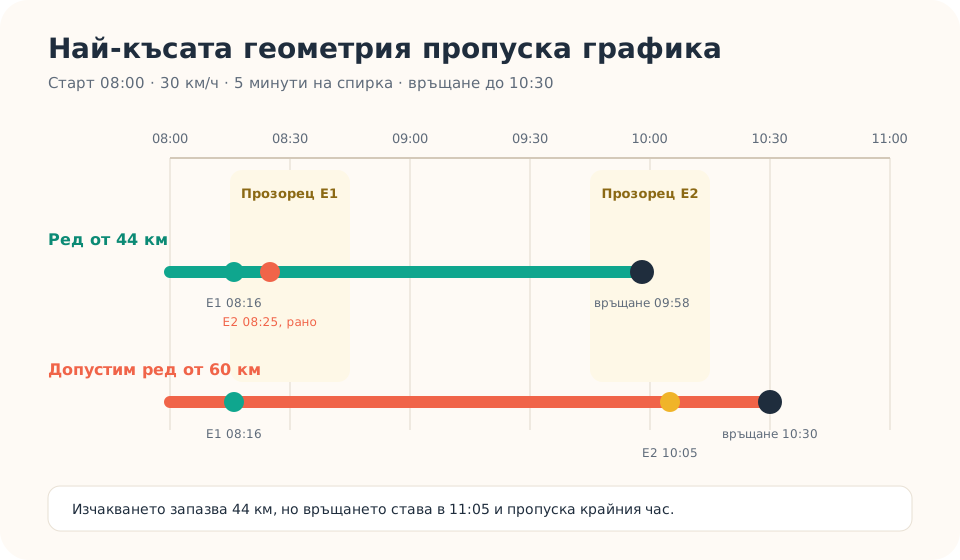
The 44 km route can wait for the customer. It misses the depot deadline.
The geographic route reaches the second timed stop too early. Waiting solves that customer window, but it pushes the depot return to 11:05. The 10:30 deadline makes that plan infeasible.
The shortest feasible sequence visits the first timed eastern stop at 08:16, travels across the western cluster, then crosses back east. Service at the second timed stop begins at 10:05 and the van returns at exactly 10:30. The east-west-east movement creates the added distance.
Google's current Route Optimization documentation treats visit windows, vehicle windows and route-duration limits as explicit constraints. Its cost model then evaluates distance, time and vehicles. That separation matters for a small business: a route can look short and still fail the working day.
One extra kilometre costs €0.18929 in diesel today
The latest European Commission Weekly Oil Bulletin available on the review date was released on 8 October. Its tax-inclusive observation for Bulgaria on 5 October reports automotive diesel at €1.8929 per litre.
fuel per km = €1.8929 × 10.0 l/100 km ÷ 100 = €0.18929
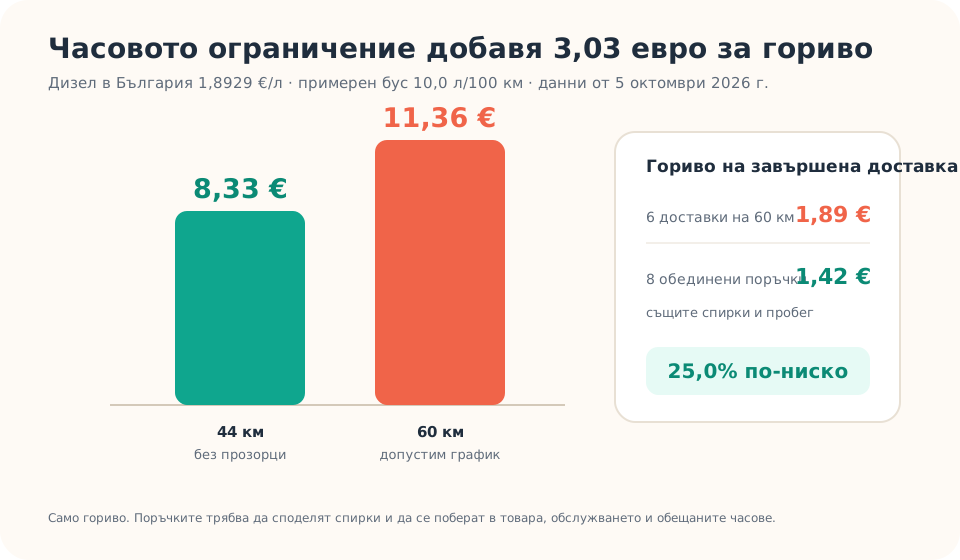
The 44 km route uses €8.33 of diesel in this example. The feasible 60 km route uses €11.36. The difference is €3.03 per run. If the same schedule repeats across 22 comparable days, the illustrative direct-fuel exposure reaches €66.63.
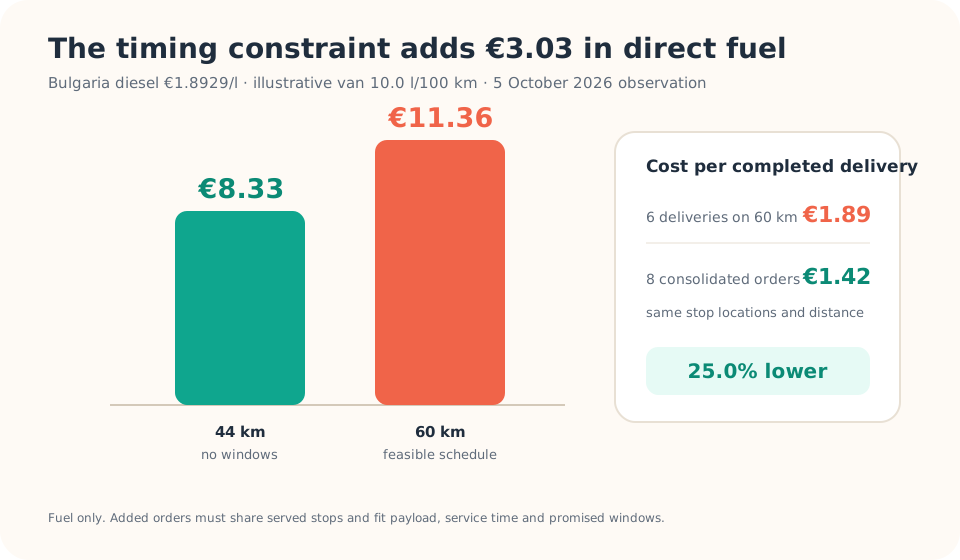
The €3.03 covers fuel alone. The 32 extra minutes can also affect driver time, vehicle availability, overtime risk and the next route. Maintenance, depreciation and financing need company records before they can be added responsibly.
The route costs €1.89 in fuel per completed delivery
Both plans complete the same six stops. Dividing route fuel by completed work turns the scheduling decision into a unit cost:
fuel per delivery = route km × fuel per km ÷ completed deliveries
| Six-stop plan | Distance | Duration | Direct diesel | Fuel per delivery |
|---|---|---|---|---|
| Geography only | 44 km | 118 min | €8.33 | €1.39 |
| Windows + deadline | 60 km | 150 min | €11.36 | €1.89 |
| Difference | +16 km | +32 min | +€3.03 | +€0.50 |
A time window can be commercially valuable. The owner still needs to see its operational price. If a customer requires a narrow interval, the business can include that service level in pricing, reserve it for suitable days, or offer a broader interval that fits existing route flow.
Route density can recover part of the cost
Suppose two additional orders can be delivered at the same buildings already on the 60 km route. If capacity, service time and every promise still fit, the van completes eight deliveries without adding distance. Direct diesel per delivery falls from €1.89 to €1.42, a 25.0% reduction.
This is a deliberately narrow consolidation example. A new address can add kilometres, service time or another constraint. The useful test is whether the order shares travel already in the plan and remains compatible with the route's capacity and schedule.
Better density comes from compatible work: nearby addresses, similar delivery windows, suitable vehicle capacity and realistic service time. More orders on a route help when the denominator grows faster than the route cost.
What a small-business owner should check before accepting the promise
- Write every constraint beside the address. Record earliest service, latest service, service minutes, load and vehicle requirements.
- Build a geography-first baseline. This exposes the distance created by the schedule rather than by the addresses themselves.
- Test the whole working day. Include depot departure, waiting, loading, breaks and required return time.
- Price the change. Compare kilometres, vehicle minutes, direct fuel and fuel per completed delivery.
- Widen the costly window. Ask whether 09:30-10:30 preserves the customer promise while removing a cross-city movement.
- Group compatible orders. Combine nearby deliveries that share timing and capacity, then check the complete route again.
- Measure the actual run. Save odometer distance, arrival times, completed deliveries, failed visits and reasons for manual changes.
Track this for two comparable weeks. Useful measures include promised-window success, kilometres per completed delivery, fuel per completion, waiting minutes and depot return reliability. Failed deliveries remain in the record because a cheap route that misses customers creates another trip.
Where MileCut fits
MileCut starts with the address list the company already uses. Upload Excel or CSV, choose one to five couriers, and review the proposed allocation and stop order on the map. Team and Control allow the planner to move stops between couriers and reorder stops before creating routes.
Use that review to keep compatible addresses together, compare planned kilometres and apply the customer knowledge held by the dispatcher. Then send each courier a separate Google Maps link.
MileCut currently does not optimize native delivery time windows or promise exact arrival times. Entering and automatically enforcing windows is outside the current product. A dispatcher with timed commitments should place and review those stops manually, then verify the schedule in the navigation and operating workflow.
Sources and limits: European Commission Weekly Oil Bulletin, Google Maps Platform time windows, Google Maps Platform cost model, Google OR-Tools vehicle routing with time windows. Sources were checked on 14 October 2026. The grid, timing, service, fuel and monthly extension are illustrative. Real roads, vehicles, traffic, prices, customer access and service times differ. This article does not claim that MileCut uses Google's Route Optimization API.
Put the promise into the route before the van leaves.
Upload the next address list, review compatible stops and compare the planned kilometres per completed delivery.