Transport Labour Cost Rose 84% in Five Years. Where Does a Delivery Route Lose Time?

Ten minutes at each of 12 delivery stops consume two vehicle-hours. The van may be parked, yet the route cost keeps moving through access, unloading, paperwork, signatures and customer handover.
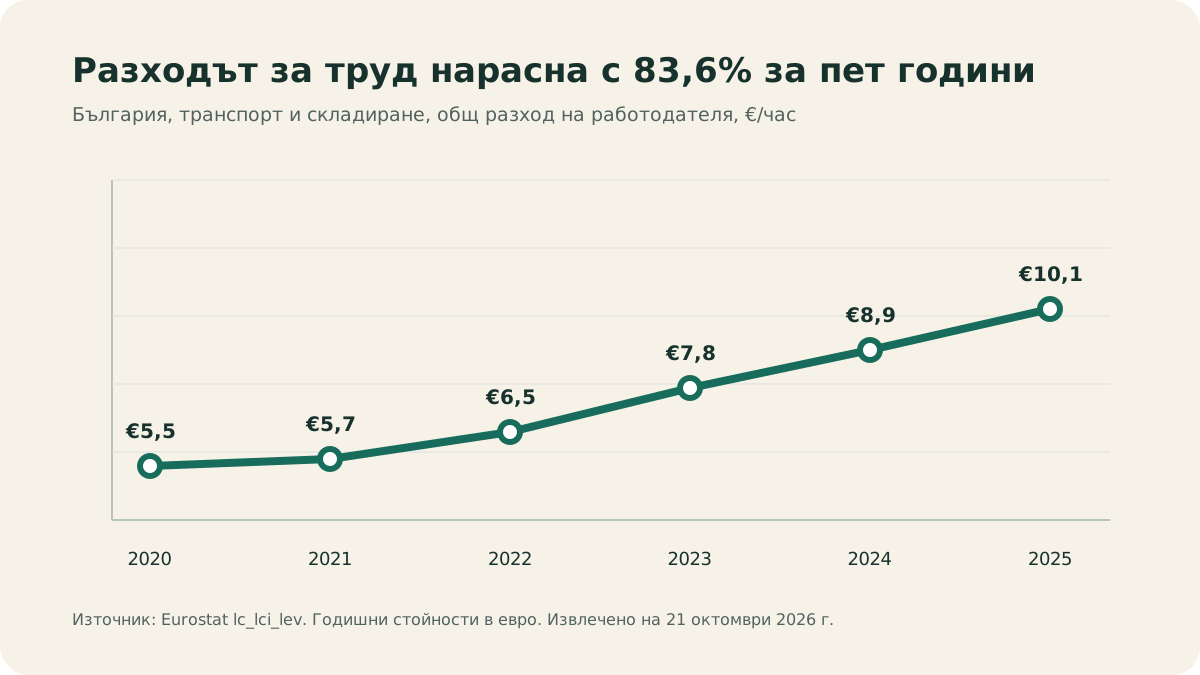
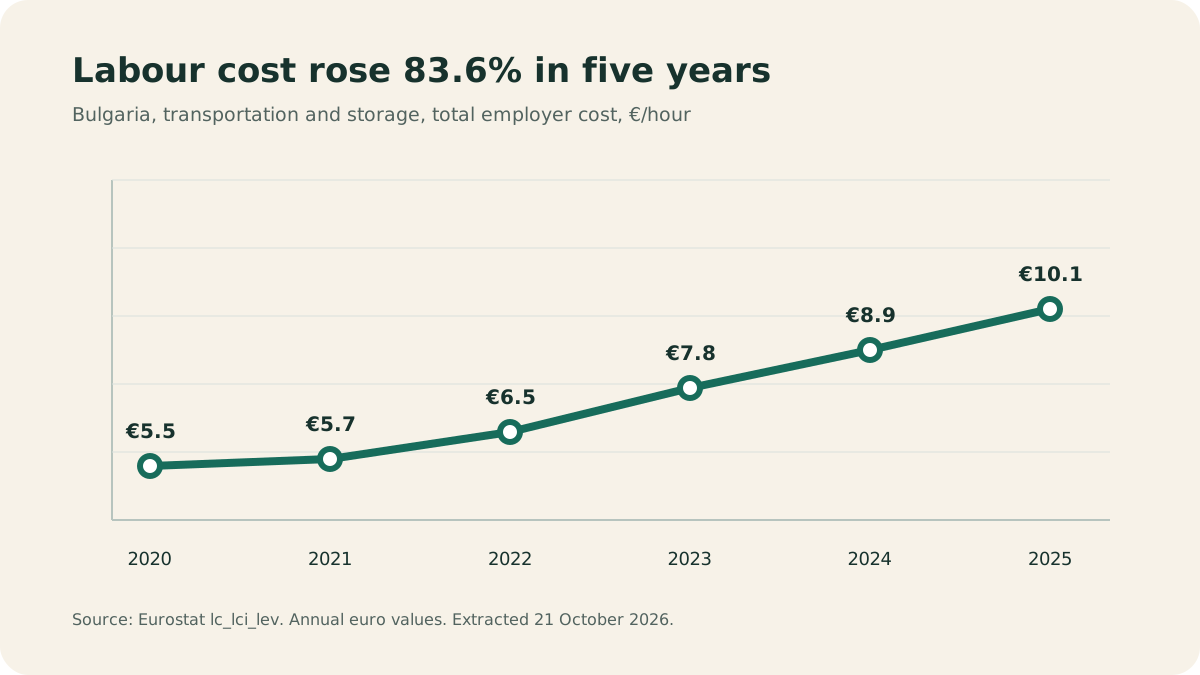
That time matters more as labour becomes more expensive. Eurostat estimates that total employer labour cost in Bulgaria's transportation and storage activity rose from €5.5 per hour in 2020 to €10.1 in 2025. The increase is 83.6%.
The 2026 index has already passed twice its 2020 base
The National Statistical Institute provides a more recent signal. Its calendar-adjusted total labour-cost index for Bulgarian transportation and storage reached 195.4 in Q1 2026 and 207.2 in Q2, with 2020 equal to 100. The Q2 level is 6.0% above Q1 and 107.2% above the base. Both 2026 values are preliminary.
The annual Eurostat series gives an absolute euro-per-hour level. The NSI series shows quarterly change as an index. They answer different questions, so the route model uses the €10.1 annual value and treats the index as directional context.
Selected CEE markets span €10.1 to €26.2 per hour
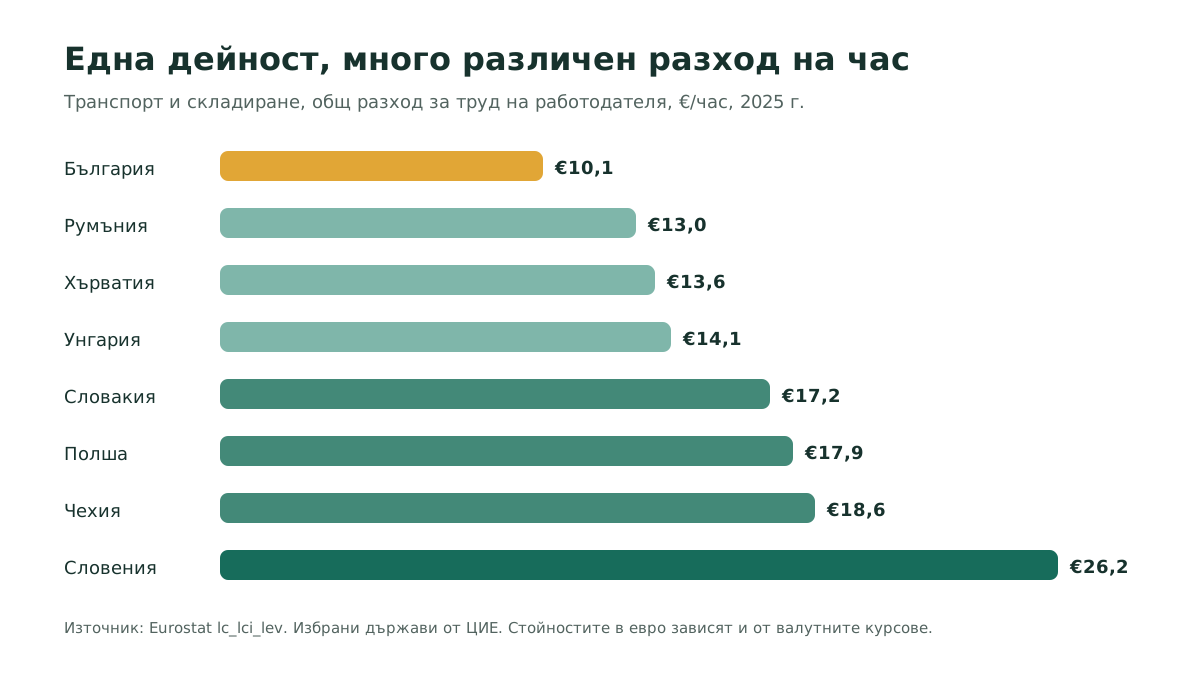
In an editorial selection of eight Central and Eastern European EU countries, Bulgaria had the lowest 2025 transportation and storage labour cost at €10.1 per hour. Slovenia was highest at €26.2, followed by Czechia at €18.6 and Poland at €17.9.
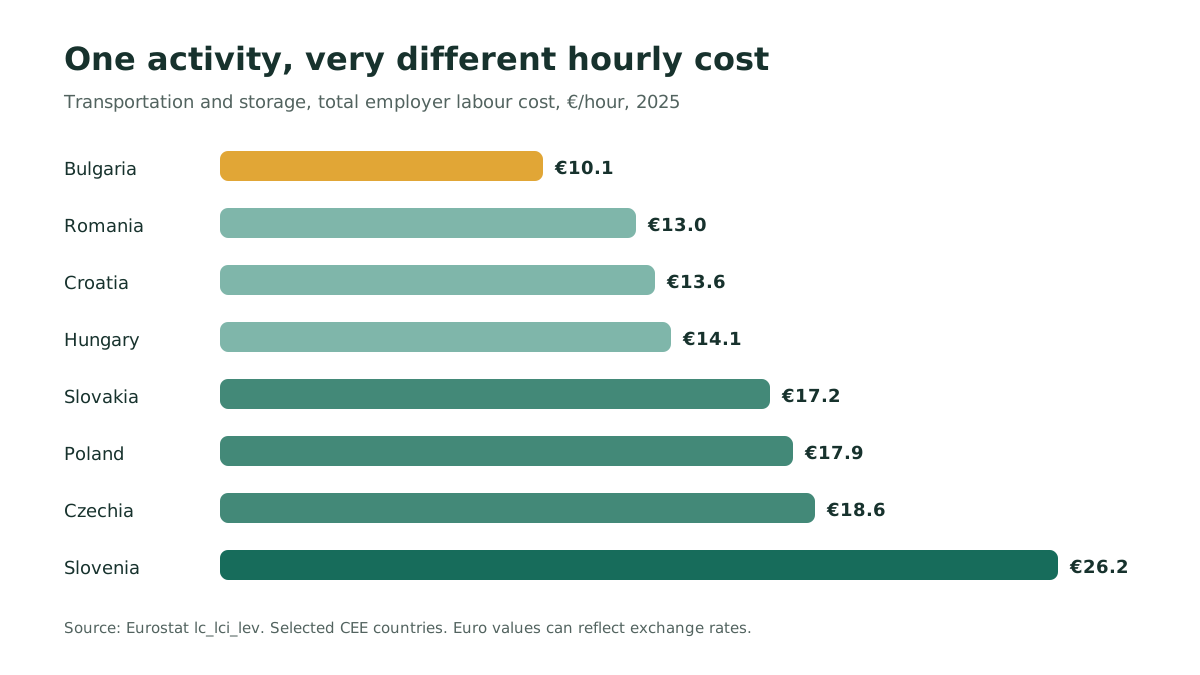
The comparison gives regional context. It cannot price a particular company. An owner needs the paid hourly cost, employer contributions, overtime practice and actual productive vehicle-hours of that operation.
One extra kilometre costs €0.19 in fuel today
The latest European Commission Weekly Oil Bulletin available on 21 October was published on 15 October. Its tax-inclusive observation for Bulgaria on 12 October gives automotive diesel at €1.8738 per litre.
fuel per km = 10.0 l/100 km ÷ 100 × €1.8738 = €0.18738
At an illustrative average route speed of 30 km/h, one kilometre also uses two minutes. At €10.1 per hour, that driving labour is €0.33667. The model therefore assigns €0.52405 per additional kilometre to fuel plus driving labour. Vehicle wear, depreciation, financing, parking and overhead remain outside the figure.
An avoided kilometre creates a direct fuel saving when completed work stays unchanged. The labour saving appears only when paid vehicle-hours fall in practice.
Twelve stops split the day almost evenly
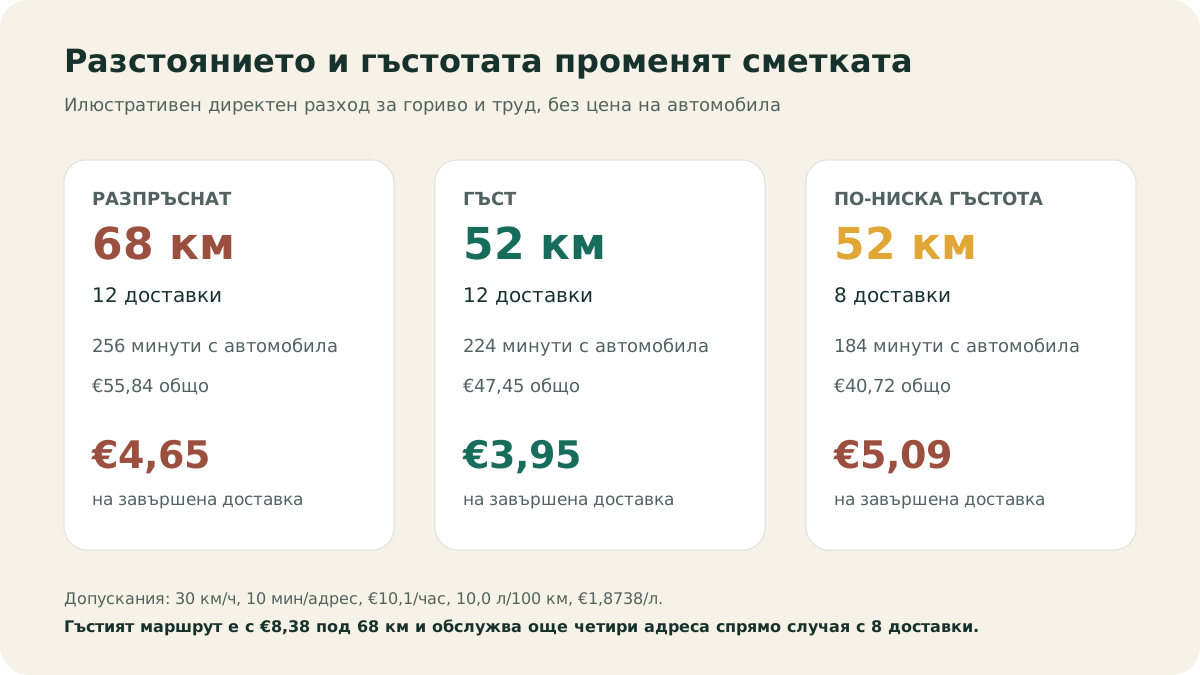
Consider an illustrative 52 km route with 12 completed deliveries. At 30 km/h, driving uses 104 minutes. Ten minutes of service at every stop add 120 minutes. The route therefore occupies 224 vehicle-minutes before breaks or depot work.
Labour comes to €37.71. Diesel is €9.74. The tracked direct total is €47.45, or €3.95 per completed delivery.
| Service time per stop | Service hours across 12 stops | Labour tied to service |
|---|---|---|
| 5 minutes | 1 hour | €10.10 |
| 10 minutes | 2 hours | €20.20 |
| 15 minutes | 3 hours | €30.30 |
| 20 minutes | 4 hours | €40.40 |
Moving from 10 to 15 minutes per stop adds one hour and €10.10 of labour across the route. That can be necessary service, avoidable waiting, or a mixture. The remedy begins with reason codes rather than a blanket target.
Sixteen avoidable kilometres add €8.38 to the model
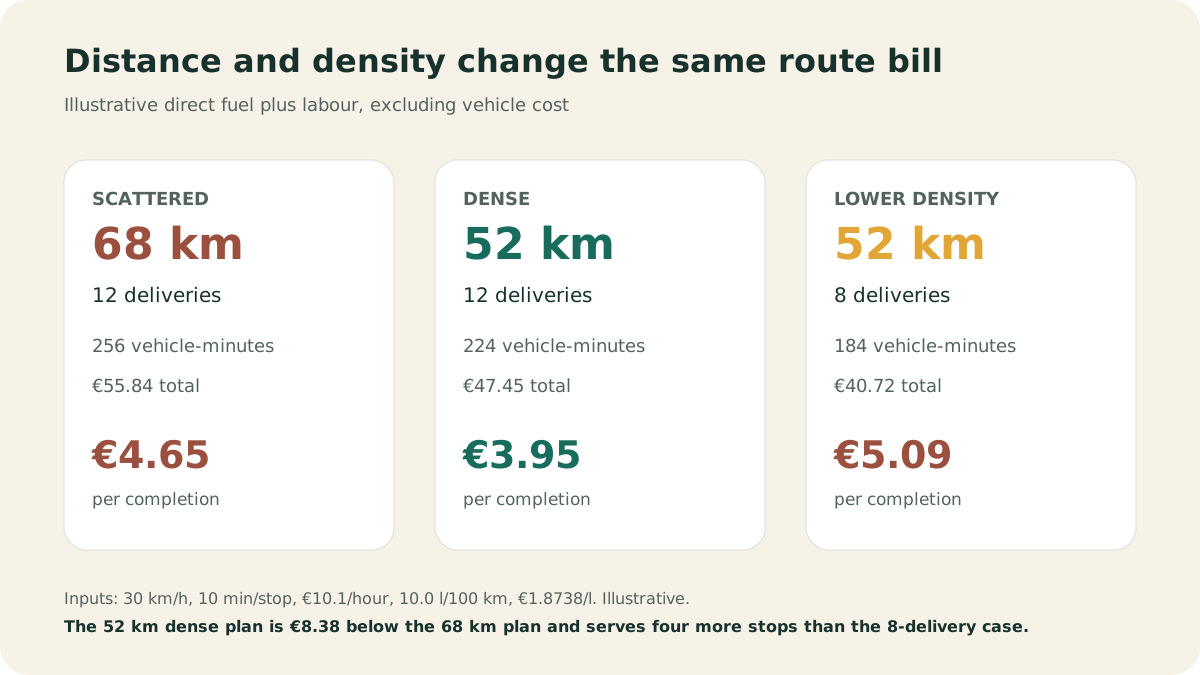
Now compare the 52 km route with a scattered 68 km version serving the same 12 customers. Service time stays at 120 minutes. Driving rises from 104 to 136 minutes. Direct fuel plus labour reaches €55.84, or €4.65 per completed delivery.
The denser 52 km plan removes 16 km and 32 driving minutes. It is €8.38 lower in this model, a 15.0% reduction, while completed work remains 12 deliveries.
Four compatible deliveries lower unit cost by 22.3%
An eight-delivery route over the same 52 km uses less service time, so its direct total is lower at €40.72. Divided across eight completions, however, the result is €5.09 each. With 12 compatible deliveries, the total rises to €47.45 while unit cost falls to €3.95.
The four added stops contribute 40 minutes and €6.73 of labour in the scenario. They add no kilometres because this is a controlled density comparison. Real stops must fit the geography, promised time, vehicle capacity and handling requirement before an owner expects the same effect.
Measure stop time without rushing the customer
- Record arrival and departure. Use two representative weeks and keep the data by stop type.
- Choose one reason code. Separate unloading, access, parking, paperwork, customer wait, missing information and service work.
- Use a realistic planning value. Start with the median for each stop type and flag the long tail for manual review.
- Keep distance beside time. Track vehicle-hours, kilometres and fuel per completed delivery.
- Group compatible stops. Share travel when area, time, capacity and handling fit the same route.
- Compare equal work. Judge route alternatives with the same completed deliveries and quality requirement.
Where MileCut fits
MileCut starts with the address list the business already uses. Upload Excel or CSV, choose one to five couriers, and review the proposed allocation, stop order and planned distance on the map. Team and Control users can move stops between couriers and reorder them before creating separate Google Maps links.
That review helps keep compatible addresses together and exposes scattered stops before they add kilometres between handovers. Record service time in the company's operating log, then use those observations when reviewing which stops belong together.
MileCut's current scope covers address import, allocation, route review, manual reordering and Google Maps links. Service-time measurement, proof of delivery, customer communication, live vehicle tracking and automatic time-window enforcement remain in the company's existing workflow.
Sources and limits: Eurostat dataset lc_lci_lev, Eurostat methodology for hourly labour costs, NSI Labour Cost Index, European Commission Weekly Oil Bulletin. Sources were checked on 21 October 2026. CEE is an editorial selection of Bulgaria, Czechia, Croatia, Hungary, Poland, Romania, Slovakia and Slovenia. The 52 km and 68 km routes, speed, stop duration, consumption and density cases are illustrative. Use company cost, route and completion records for decisions. External averages do not establish MileCut savings.
Measure the minutes, then remove the avoidable kilometres.
Upload the address list, keep compatible stops together and review planned distance for every courier.