Central and Eastern Europe shares trade routes, supply risks and exposure to the same global oil market. Each country still produces a distinct pump price.
On 14 September 2026, average petrol prices among the eight countries in this series ranged from €1.620 per litre in Bulgaria to €1.889 in Romania. Diesel ranged from €1.854 in Slovenia to €2.005 in Poland. Bulgaria had the lowest petrol price. Slovenia had the lowest diesel price. The product and country both matter in a regional comparison.
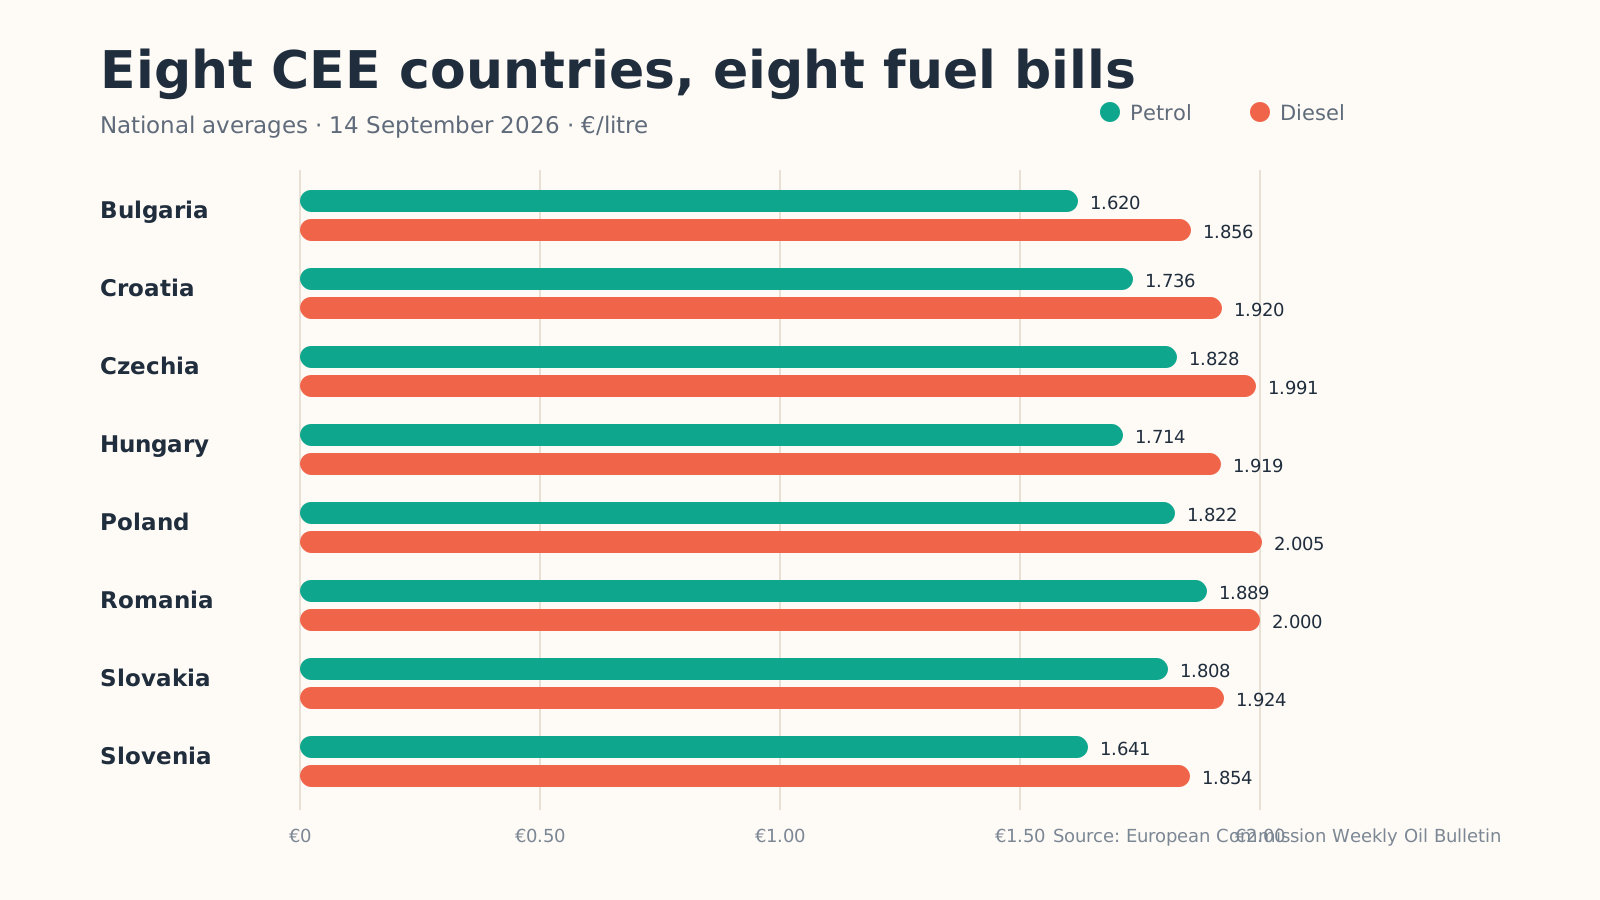
For a diesel van consuming 10 litres per 100 kilometres, this week's national averages translate into €0.185–€0.201 of fuel per kilometre across the eight markets. Every 1,000 kilometres removed from completed routes therefore creates about €185–€201 in direct fuel savings, depending on the country where the vehicle refuels.
Taxes explain one part of the gap
The effective tax component of petrol in the comparison ranged from 39.1% in Bulgaria to 49.3% in Slovakia. For diesel, it ranged from 33.5% in Croatia to 40.0% in Hungary. These figures represent the aggregate difference between the Commission's prices with and without taxes.
The pre-tax table also varies by country. Those differences point to wholesale product prices, supply routes, currency, regulation, inventories, blending, logistics and market structure alongside taxation.
Year-on-year inflation can tell a different story from the price level
In August 2026, Eurostat recorded a 23.8% year-on-year increase in fuels and lubricants for personal transport across the EU. Bulgaria recorded the highest increase, at 34.5%. Hungary's increase was 1.3%.
This means Bulgaria's price level had risen fastest relative to its own August 2025 base. Price level and inflation rate answer different questions:
- Price level: What does a litre cost now?
- Annual change: How much more or less does it cost than a year earlier?
- Monthly change: Is the immediate pressure accelerating or easing?
For a small company, the annual rate shows how far a current fuel budget may have drifted from the assumptions used when customer contracts were agreed.
Why neighbouring countries diverge
Five differences are especially relevant in CEE:
- Currency exposure. Euro-area members and countries with their own currencies can experience the dollar oil shock differently.
- Tax and intervention choices. Excise, VAT and temporary government measures change both the level and timing of retail prices.
- Supply infrastructure. Access to refineries, ports, pipelines, terminals and tax warehouses changes replacement and transport costs.
- Product mix. A diesel-heavy commercial market is exposed to diesel refining margins alongside crude prices.
- Competition and inventory cycles. Retail density, wholesale access and how quickly stock turns over affect pass-through.
These factors combine differently in each market. Lower tax can coincide with higher pre-tax supply costs. Temporary retail-price measures can shift pressure to another part of the chain. A headline ranking therefore begins the analysis; current national evidence completes it.
The business response should be regional and local
A company operating across borders should maintain a country-level price input, record where vehicles actually refuel and separate petrol, diesel, LPG and electricity. A Bulgarian urban delivery route and a Polish intercity route face different prices, taxes, traffic and operating patterns.
The regional view is useful for context. The local route and the actual vehicle determine the cost.
Put the country difference into the route plan
Maintain one fuel-price assumption for each country where vehicles refuel, then apply it to the planned kilometres in that market. Track three route-density measures beside the price: completed deliveries per route, kilometres per completed delivery and fuel cost per completed delivery. These measures show whether a higher national price is reaching the business and whether denser routes are absorbing part of the increase.
For a cross-border stop list, MileCut can improve the sequence and vehicle allocation before dispatch. The business can multiply the resulting kilometres by the relevant country fuel cost per kilometre and compare alternative plans. Fewer overlapping routes and more compatible deliveries on one vehicle create direct savings in the country where every kilometre is actually driven.
Sources: European Commission: Weekly Oil Bulletin, 17 September 2026, Eurostat: fuel-price change in August 2026, European Commission: excise duties.
Measure the next route before it leaves.
Upload real stops, review the plan and compare it with your current baseline.