
When fuel becomes more expensive, the first explanation is usually “oil went up.” Oil is one link in a longer chain that ends in the cost of every route.
The price displayed at a filling station is the final result of a chain. Crude oil has to be bought, transported, refined into usable products, blended to meet fuel standards, stored, moved to terminals and stations, and sold through a local market. Excise duty and value-added tax are then part of the amount paid by the customer. A change at any link can move the final price.
The seven forces behind a fuel-price change
1. Crude oil supply and demand
Global production, consumption, spare capacity and inventories influence the price of crude oil. Producer decisions, unexpected outages and changes in economic activity can move the market before any physical shortage reaches a local station.
Owner action: Record the invoiced price per litre and fuel cost per kilometre every week. Compare both with a four-week average. This shows how a global change is reaching the company's own vehicles and gives the next route plan a current cost assumption.
2. Geopolitics and transport routes
The credible risk of a blocked shipping route, damage to energy infrastructure or sanctions can raise freight, insurance and replacement-supply costs. In 2026, the International Energy Agency described tight product markets, depleted stocks and record European refining margins during disruption around the Strait of Hormuz. Crude oil and finished diesel or petrol can therefore follow different price paths.
Owner action: Recalculate route contribution at the current fuel price, then at prices 10% and 20% higher. Rank the routes by the margin left after fuel and driver time. The first routes to turn weak need denser stop groups, a new delivery day or a revised customer price.
3. Refining capacity and product margins
A litre of diesel contains several cost layers beyond crude. Refineries must turn crude into the particular products the market needs. Maintenance, outages, product shortages and seasonal demand can widen the difference between the crude price and the wholesale price of diesel or petrol. A company watching Brent alone can therefore miss pressure building in refined products.
Owner action: Track the fuel used by the actual fleet. A diesel-van business needs the diesel series, its real litres per 100 kilometres and its kilometres per completed delivery. Together they reveal the effect of a diesel-specific shock on the company's economics.
4. Currency
International oil is commonly priced in US dollars. A business pays at a local pump. A weaker local currency against the dollar can make imported energy more expensive even when the dollar price of oil is unchanged. The effect differs across CEE because the countries use different currency arrangements.
Owner action: Cross-border operators should record the country and currency of each fill. Convert the invoiced amount to one reporting currency and compare the fuel cost of each route. Refuelling choices should fit the planned route so that a cheaper pump never creates an expensive detour.
5. Taxes and government measures
The EU sets a common framework and minimum excise levels. Countries can use different rates above those minimums, as well as different VAT rates and temporary measures. Fixed per-litre tax components partly cushion a percentage increase in crude. A VAT change can alter the pump price directly.
Owner action: Mark every tax or support measure with its start and end date in the fuel budget. Review customer quotes before a temporary measure expires, using the route's current kilometres and deliveries alongside the latest price per litre.
6. Inventories and time lags
Fuel in storage may have been bought at an earlier, higher or lower cost. Retail prices can therefore move on a different timetable from crude. Bulgaria's competition authority has previously explained that inventory turnover and the timing of purchases can delay the pass-through. Reductions may appear more slowly as higher-cost stock moves through the market.
Owner action: Use a rolling four-week average from company invoices beside the weekly national benchmark. This reduces overreaction to one headline and shows whether the price paid by the business is moving faster or slower than the market reference.
7. Local logistics and competition
Terminals, tax warehouses, import access, distance to supply, station location, sales volume and nearby competitors all matter. A transparent national average can hide meaningful differences between motorway, urban and smaller-town stations.
Owner action: Compare the fuel-card or contracted-station price with the national average, then add the kilometres needed to reach that station. A low pump price helps when the refuelling plan preserves route density and vehicle time.
Turn the seven forces into route decisions
Every force reaches the company through the same operating equation:
route fuel cost = planned kilometres × litres per 100 km ÷ 100 × €/litre
The price is largely external. Planned kilometres and deliveries per route are operating decisions. Grouping nearby stops, assigning them to the same vehicle and selecting a stronger sequence can reduce repeated crossings and excessive distance. More completed deliveries on a well-designed route spread its fuel and driver cost across more customer orders.
MileCut makes this response practical. The owner can upload the day's stops, review the proposed vehicle allocation and stop order on a map, then send the routes to drivers through Google Maps links. Comparing MileCut's planned kilometres with the usual plan turns a market signal into a measurable cost decision before the vans leave.
Why the percentage at the pump is different
The European Central Bank's 2026 explanation divides the pump price into crude, refining and distribution margins, and taxes. A 10% crude-oil increase can produce a different percentage change at the pump. Fixed taxes and other costs can dampen the percentage pass-through. Refining or distribution pressure can amplify the movement independently.
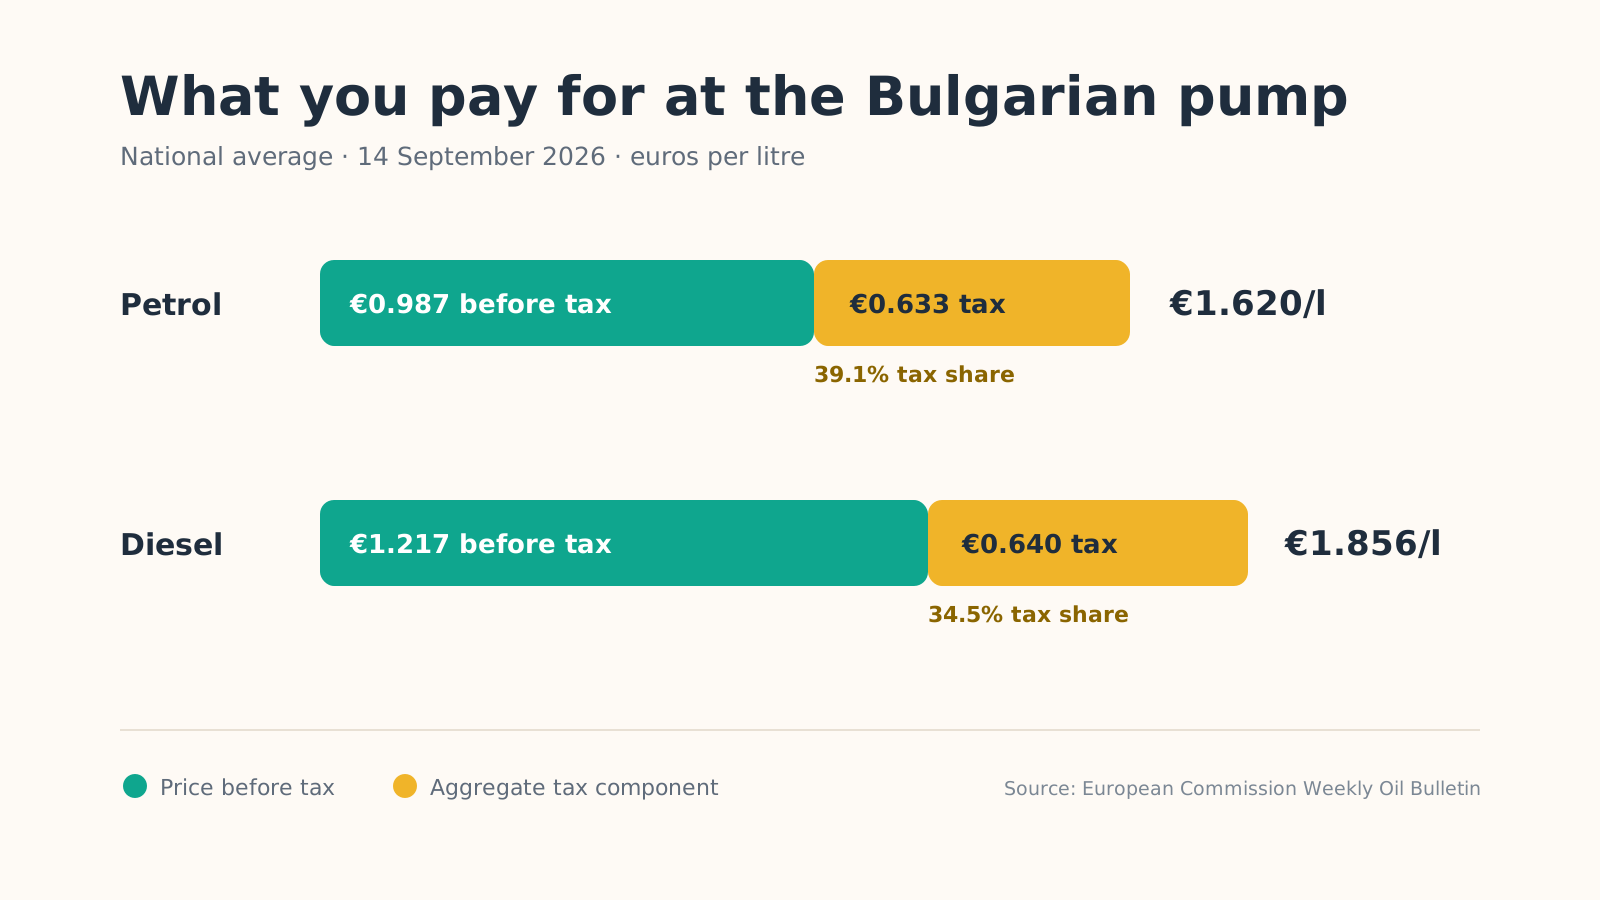
The practical lesson is to watch the full chain of indicators:
- crude and refined-product prices;
- the dollar exchange rate relevant to the business;
- national tax or price-control changes;
- refinery, port and pipeline disruptions;
- weekly pump prices with and without tax;
- the company's own litres, kilometres and vehicle-hours.
The first five explain the market. The last one determines the bill.
Sources: European Central Bank: From well to pump, European Commission: Weekly Oil Bulletin, European Commission: fuel taxation, IEA: Oil Market Report, August 2026, Bulgarian Commission on Protection of Competition: price formation and lags.
Measure the next route before it leaves.
Upload real stops, review the plan and compare it with your current baseline.