Online Buying in Bulgaria Rose 20 Points. Can Your Routes Keep Up?
In 2025, 51.2% of people aged 16 to 74 in Bulgaria had bought something online during the previous 12 months. In 2020, the share was 30.95%.
The increase is 20.25 percentage points in five years. That is a demand signal for retailers and delivery operators. It is also a warning about route economics: more orders create value when compatible stops fit into productive routes.
The survey counts people and includes purchases of services. Parcel, delivery and revenue counts require company records. A business needs its own order history to estimate physical delivery demand.
Bulgaria crossed 50% in 2025
The Bulgarian share rose every year in the six-year series. The largest annual step came between 2021 and 2022, when the measure moved from 33.04% to 40.54%.
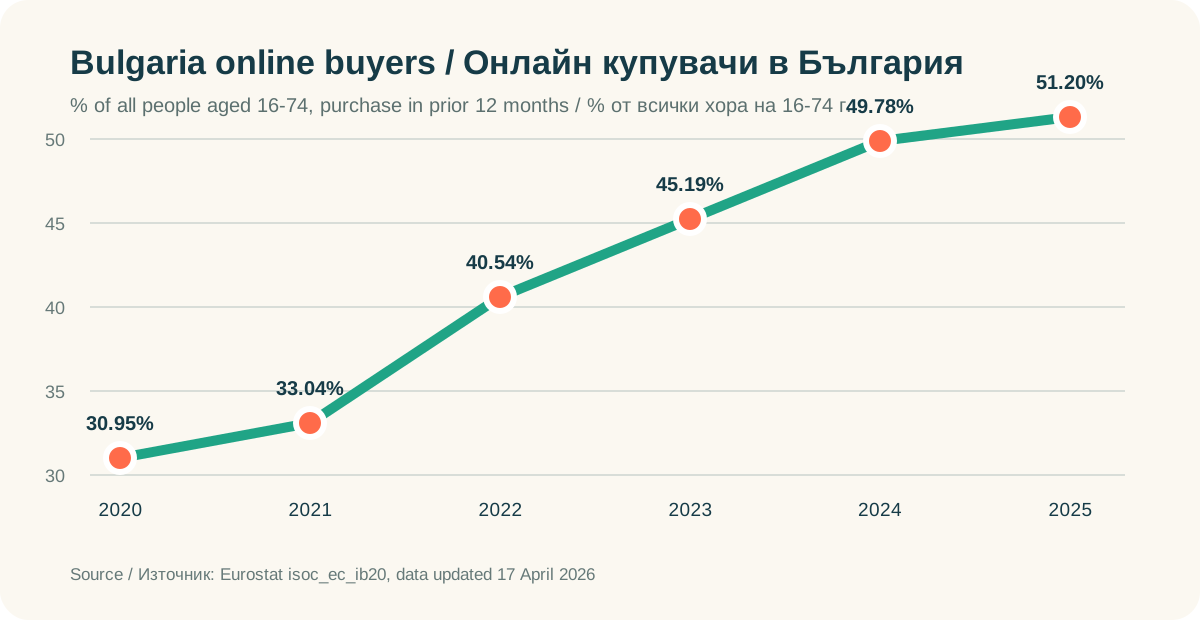
By 2025 Bulgaria had reached 51.20%, while the EU stood at 73.56%. The 22.36-point gap shows room for wider adoption. A growth forecast for an individual company needs its own order and customer data.
CEE contains very different online-buying markets
Czechia leads this selected CEE comparison at 83.67%. Slovakia follows at 78.76%, Estonia at 76.53%, and all three stand above the EU figure. Bulgaria records the lowest share in the group, followed by Romania at 60.28% and Croatia at 61.72%.
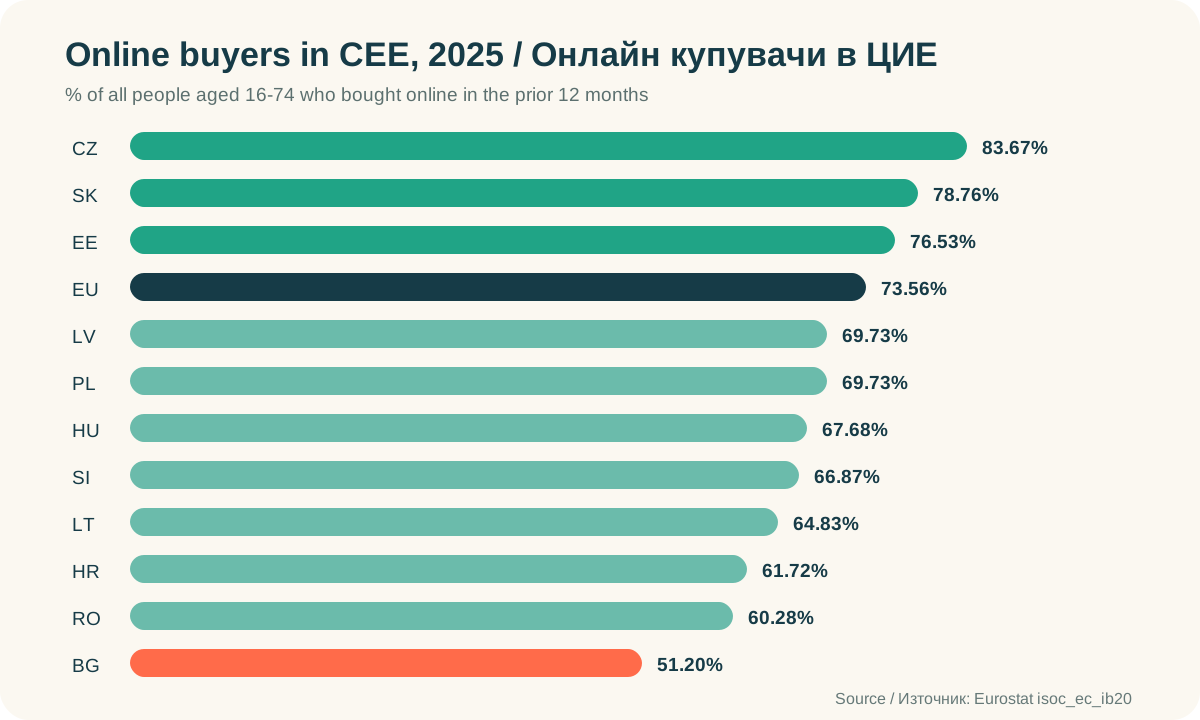
The comparison helps an owner judge market maturity. Company decisions still depend on product type, service area, customer frequency and the share of orders requiring physical delivery.
Demand growth can make routes denser or more scattered
Five additional orders in one neighbourhood may improve the day. Five orders spread across distant corridors may consume the margin they create.
deliveries per route = completed deliveries ÷ routes run
kilometres per delivery = total route kilometres ÷ completed deliveries
fuel per delivery = kilometres × litres per 100 km ÷ 100 × price per litre ÷ completed deliveries
A rising order count has operational value when deliveries per route rise and kilometres per delivery remain stable or fall.
A denser route can cut fuel per delivery by 13.6%
Consider an illustrative route of 100 km and 20 completed deliveries. At 10 l/100 km and Bulgarian diesel of €1.9156 per litre, fuel costs €19.16. That equals €0.958 per completed delivery.
| Illustrative plan | Distance | Deliveries | Km/delivery | Fuel/delivery |
|---|---|---|---|---|
| Baseline | 100 km | 20 | 5.00 | €0.958 |
| Denser corridor | 108 km | 25 | 4.32 | €0.828 |
Five already-scheduled, compatible deliveries along the same corridor add 8 km in this example. Total fuel rises to €20.69, while fuel per delivery falls by 13.6%. The five added deliveries use €1.53 of additional fuel.
The actual result depends on addresses, time windows, traffic, vehicle capacity and successful completion. Compare the complete plan for the full order list.
Slow and failed deliveries can erase the density gain
Across the EU, 20% of 2025 e-shoppers reported slower delivery than expected. Ten percent reported receiving wrong or damaged goods. These are EU customer-experience measures. Bulgarian route-failure rates require Bulgarian operational data.
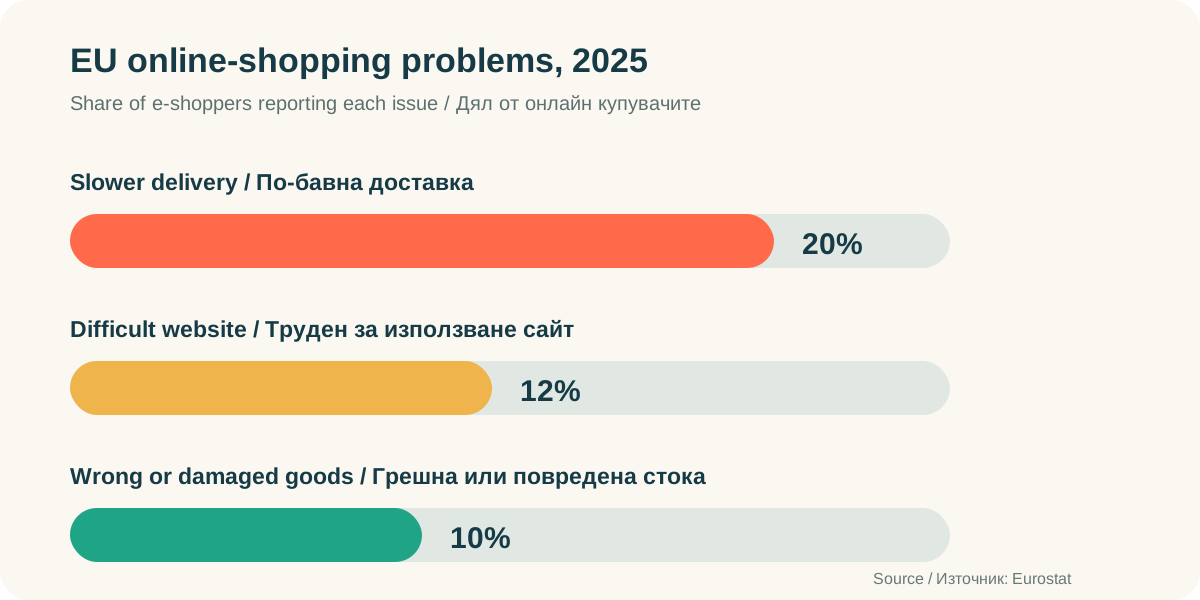
For a small operator, the practical link is clear. A bad address, missing access instruction, overloaded route or unrealistic promise can turn a dense plan into a repeat journey.
Record the reason for every incomplete stop. Separate customer absence, address quality, access, capacity, damaged goods and late arrival. The weekly pattern shows which problems belong in planning and which require a change elsewhere in the operation.
Build routes after the order cut-off
- Set a clear order cut-off for each delivery wave.
- Clean addresses and remove duplicates before allocation.
- Group compatible stops by geography and time window.
- Compare the total plan across every available vehicle.
- Review kilometres per delivery and deliveries per route before dispatch.
- Keep failed stops visible in the next day's cost.
- Recalculate fuel per delivery with the invoice price and measured consumption.
MileCut supports this planning cycle. Upload the address list, review the allocation between vehicles, improve the stop order and share the routes through Google Maps. The result to watch is measurable: more completed deliveries per route with fewer kilometres per delivery.
Use the order list you already have: see the address upload, route review and Google Maps sharing workflow.
Start with seven comparable delivery days. Save the manual baseline, then compare it with the planned result before the vehicles leave. Verified distance removed from completed work is direct fuel saving at €0.19156 per kilometre under the current example inputs.
Sources and limits: Eurostat: E-commerce statistics for individuals, 2025, Eurostat dataset isoc_ec_ib20, Eurostat Data Browser, Eurostat ICT survey metadata, European Commission Weekly Oil Bulletin. The online-purchase measure covers private purchases by people aged 16 to 74 during the previous 12 months and includes goods and services. The customer-problem figures describe the EU overall. The route calculation is illustrative and excludes driver time, maintenance, depreciation and failed-delivery cost.
Test whether the next order list makes routes denser.
Upload the scheduled stops, review the allocation and compare kilometres per completed delivery.