Route arithmetic gives a company a stable planning method during uncertain fuel markets.
A small business can improve its cost structure with a clean baseline, a better daily plan and a short review cycle. This work remains useful under every oil price forecast.
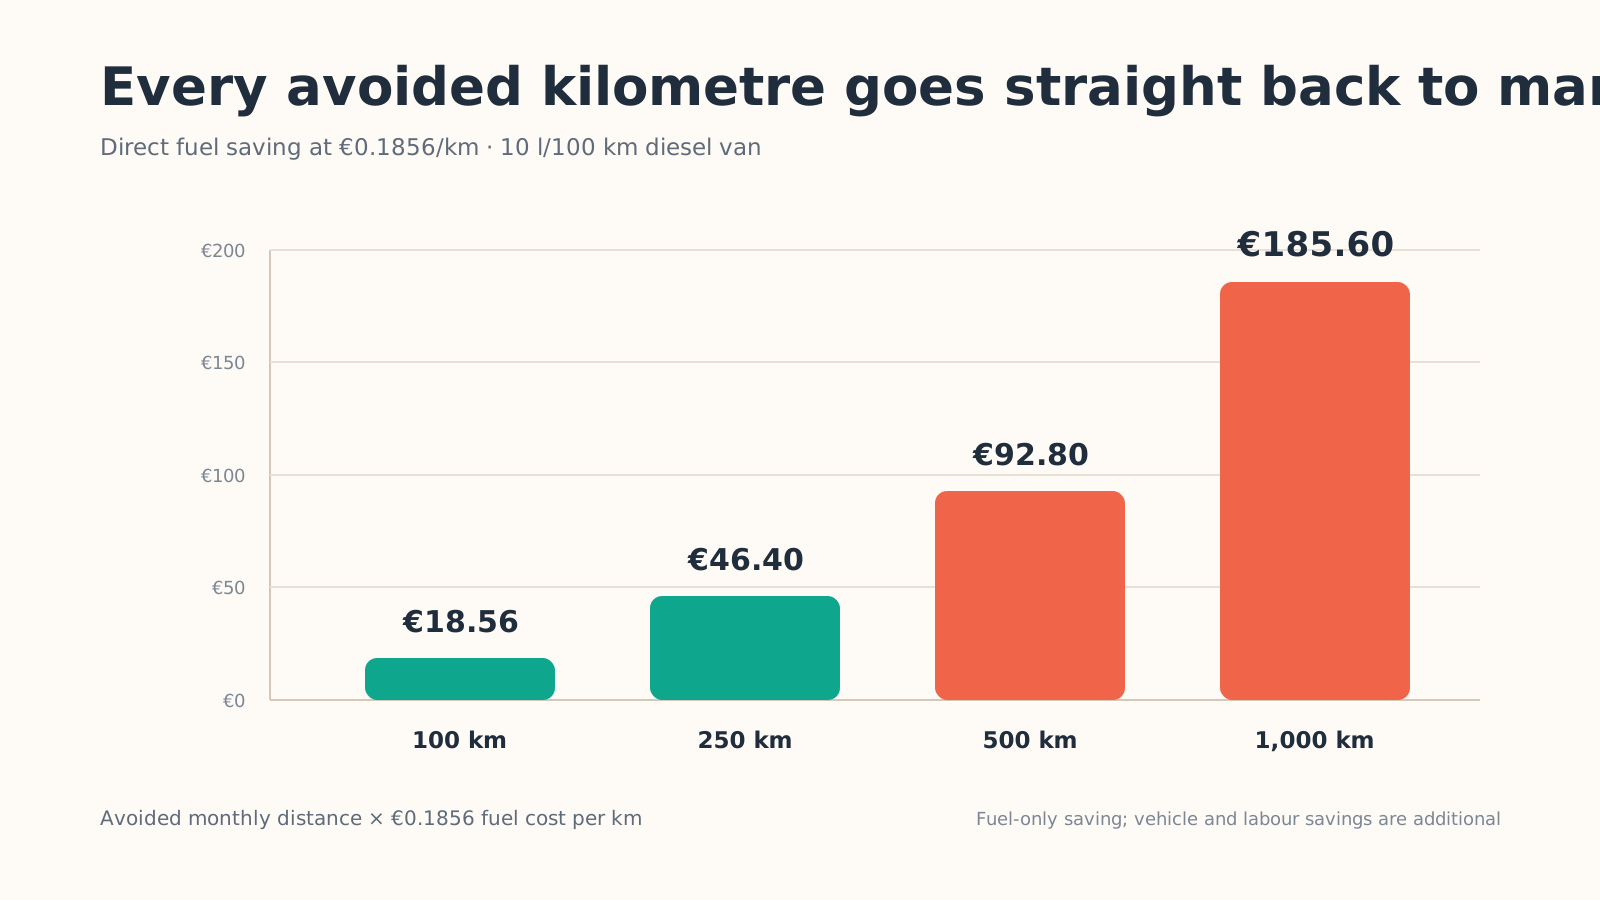
Every measured kilometre removed from the completed route is a direct saving. At today's Bulgarian diesel benchmark, 100 avoided kilometres return €18.56 in fuel to the monthly margin. The same route improvement keeps producing value through later fuel-price cycles.
Step 1: Establish the baseline
Use four normal operating weeks. For each vehicle and route, record:
- kilometres driven;
- litres purchased or consumed;
- paid driver-hours;
- planned stops, completed stops and failed stops;
- time spent driving, waiting and serving;
- route revenue where available.
Compare routes with kilometres and driver-hours per completed stop so different stop counts remain comparable.
Keep three headline measures visible throughout the 30-day test:
- Deliveries per route: completed deliveries divided by routes run.
- Kilometres per delivery: total kilometres divided by completed deliveries.
- Fuel cost per delivery: total fuel cost divided by completed deliveries.
The first should rise when compatible stops are consolidated. The next two should fall when the plan removes excessive distance.
Step 2: Remove avoidable distance before buying anything
Check for the common planning leaks:
- the same neighbourhood appears on multiple routes;
- routes cross each other;
- the depot start or end is wrong;
- a distant stop is dispatched alone when it could be consolidated;
- one vehicle is overloaded while another is underused;
- the sequence ignores time windows or road conditions;
- invalid or ambiguous addresses are discovered only after departure.
These planning problems should be resolved before the business considers extra vehicle capacity.
Step 3: Optimize the full route
Choosing the nearest next stop can create a poor overall sequence. A route plan should consider all stops, the number of vehicles, start and end locations, working time and delivery constraints together.
Research shows that outcomes depend on the starting route and operating context. A case study of three company routes reported distance reductions of 1.82% to 7.16%. A Paris parcel-network study reported a 22.6% improvement in travel time and distance. Different baselines, networks and methods produced different outcomes. MileCut should therefore invite a company to compare its own before and after data and publish measured customer results.
In MileCut, the dispatcher can upload an Excel or CSV stop list, review the proposed route allocation and stop sequence on the map, and share Google Maps links with drivers. This connects the optimization step to the existing daily workflow. Saving the previous plan creates the baseline needed to measure avoided kilometres honestly.
Step 4: Turn distance into money with transparent assumptions
Consider this clearly labelled illustrative example:
| Assumption | Example value |
|---|---|
| Vans | 5 |
| Kilometres per van per working day | 120 km |
| Working days per month | 22 |
| Average consumption | 10 l/100 km |
| Diesel price | €1.856/l |
Monthly distance is 13,200 km. At 10 litres per 100 km, the fleet uses 1,320 litres. At €1.856 per litre, the illustrative monthly fuel bill is €2,449.92.
| Measured distance reduction | Fuel-only monthly difference |
|---|---|
| 3% | €73.50 |
| 5% | €122.50 |
| 8% | €195.99 |
| 10% | €244.99 |
The calculation excludes driver time, maintenance, tyres, depreciation, tolls, failed stops and extra capacity. Add those only with the company's real data. The diesel price is the Bulgarian national average for 14 September 2026; an actual fleet should use its invoiced price.
Step 5: Validate the plan with operating data
Run a two-week controlled comparison:
- Keep the service area, vehicle mix and workload as comparable as possible.
- Save the original manually planned route before optimization.
- Record planned and actual kilometres and times.
- Note exceptions: traffic, customer delays, road closures and failed stops.
- Compare cost per completed stop together with total distance.
When distance falls and driver-hours rise, investigate the source of the added time. Regular driver deviations from a shorter planned route can reveal an impractical plan or incorrect input data.
Step 6: Protect the commercial model
Planning reduces operating exposure. Three financial controls address the remaining market volatility:
- use a current fuel assumption in every new quote;
- define when a fuel surcharge or price review is triggered;
- keep a base, moderate-shock and severe-shock budget.
For example, recalculate route contribution at the current price, at +10% and at +20%. This scenario analysis shows which customer routes lose margin first and where operational improvement matters most.
The operating principle
Describe the software's role precisely: smart planning can require fewer kilometres and fewer vehicle-hours for the same completed work. When the price per litre rises, every avoided litre becomes more valuable. When it falls, the better route still saves time and vehicle use.
MileCut matters because it moves the cost decision to the moment when the owner can still change it. Before dispatch, the business can consolidate compatible deliveries, reduce route overlap and compare planned distance with its normal baseline. After dispatch, it can review completed deliveries and actual kilometres. Repeating that cycle turns route planning into a direct-savings practice used on every dispatch cycle.
Sources: European Commission: Weekly Oil Bulletin, company pickup-and-delivery optimization case study, Paris parcel-network routing study, EU Urban Mobility Observatory: urban logistics recommendations.
Measure the next route before it leaves.
Upload real stops, review the plan and compare it with your current baseline.