27% of Bulgaria's Freight Kilometres Ran Empty. What Is Your Van Carrying Back?
Eurostat counted 598 million empty kilometres by Bulgarian-registered freight vehicles in 2025. Those kilometres represented 27.2% of their total distance.
This is a national heavy-freight benchmark. Many small vans fall outside the survey. Its value for a delivery owner is the question it creates: what share of your own distance earns no completed delivery?
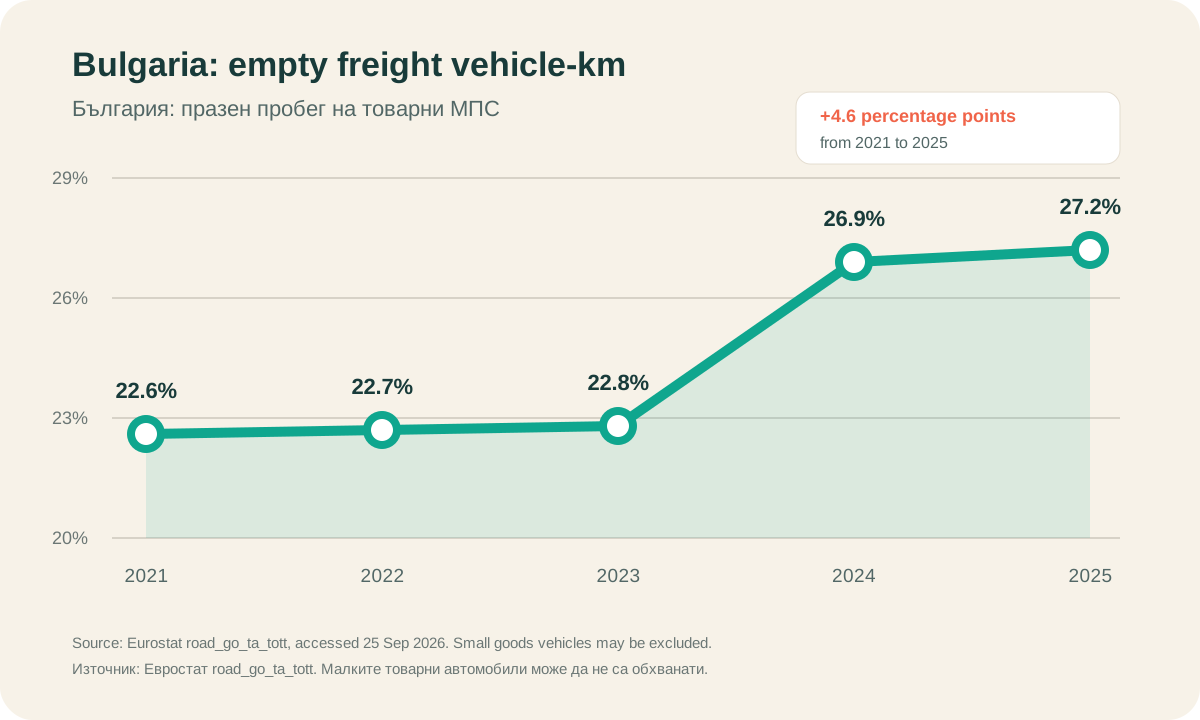
The empty share rose by 4.6 percentage points
Bulgaria's series stayed close to 23% from 2021 through 2023. It moved to 26.9% in 2024 and 27.2% in 2025. Over five years, the empty share increased by 4.6 percentage points.
Eurostat's 2025 publication places the EU benchmark at 21.8%. Bulgaria stands 5.4 points above it. Within this selected CEE comparison, Bulgaria records the highest share, followed by Croatia at 24.5% and Estonia at 23.5%. Lithuania records 10.9%.
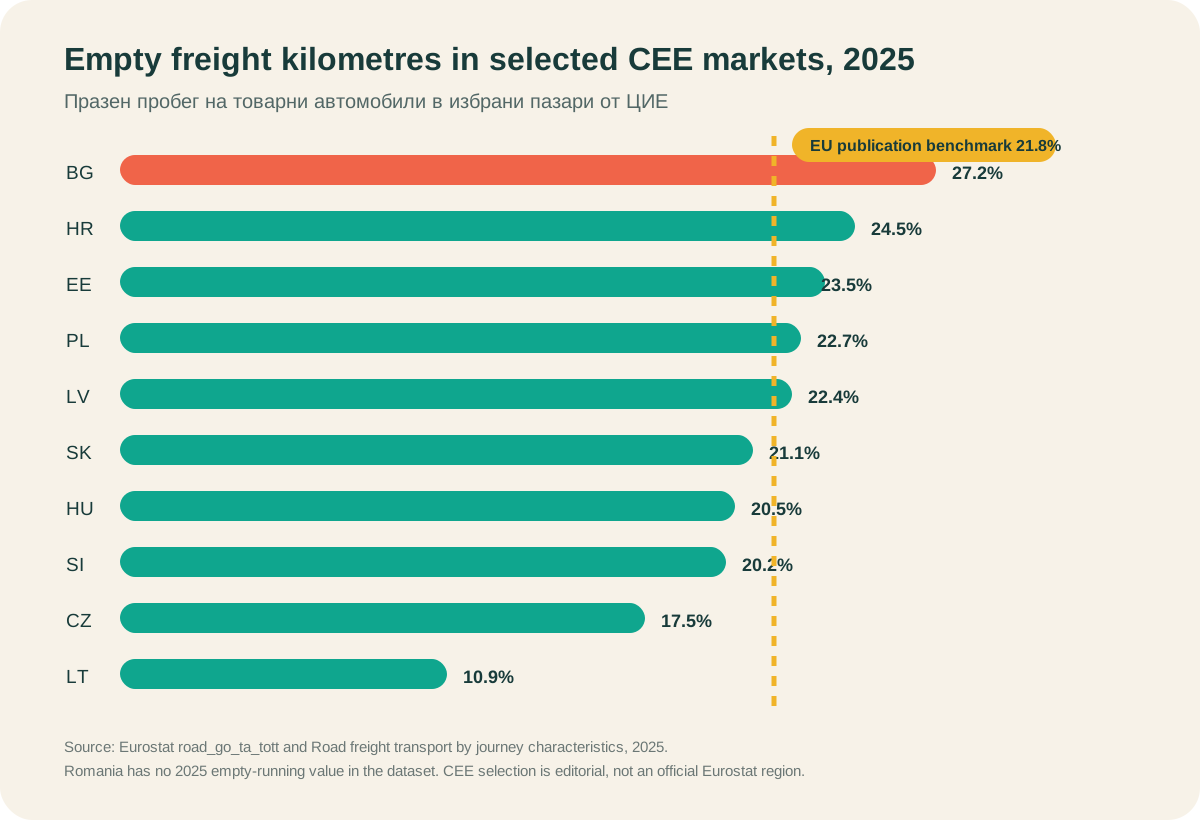
These figures describe vehicles registered in each country. Freight structure, domestic and international work, geography, ports, construction activity and access to return loads all influence the result. The comparison supplies context. A local delivery company still needs its own target.
What an empty kilometre means in a small operation
An empty leg starts when the vehicle has completed its useful work and still has distance left before the depot, the next collection or the next paying stop. A van may be physically empty, partly loaded with returns, or carrying equipment. The useful business definition is operational:
empty share = kilometres without a completed delivery or collection ÷ total route kilometres × 100
Choose one definition and keep it stable for a month. A florist, field-service team and wholesaler will classify useful work differently. Consistency makes routes comparable.
The first cash cost is €0.19156 per kilometre
The European Commission bulletin published on 24 September places Bulgarian diesel at €1.9156 per litre for 21 September 2026. A van consuming 10 l/100 km spends €0.19156 on fuel for each kilometre.
| Measured empty share | Empty km per 1,000 km | Fuel spent |
|---|---|---|
| 10% | 100 km | €19.16 |
| 20% | 200 km | €38.31 |
| 27.2% | 272 km | €52.10 |
The final row is an illustration using the national freight benchmark. Replace it with your own share, invoice price and measured consumption.
Driver time and distance-based maintenance may increase the cost. Add them from company records. A fixed lease becomes a saving when planning removes a vehicle, rental day or shift from the operation.
Four forces create empty distance
Demand points in one direction
Deliveries leave the depot in the morning and few collections bring the vehicle back through productive stops. Map the final stop and return leg for every route, then look for scheduled collections, supplier visits or service calls in the same corridor.
Time windows split compatible stops
Two nearby customers can end up on separate routes when their promised times fall in different windows. Record the windows that repeatedly force a second trip and discuss broader windows where the customer relationship allows it.
Vehicles are allocated before the whole order list is visible
Early manual assignments can leave one route thin and another dense. Delay final allocation until the cut-off time, then compare deliveries per route and kilometres per delivery.
Failed stops create repeat journeys
A bad address, absent recipient or missing access instruction turns distance into work without completion. Track failure reasons and correct the input before the route is planned again.
More compatible deliveries improve the return leg
deliveries per route = completed deliveries ÷ routes run
kilometres per delivery = total route kilometres ÷ completed deliveries
Suppose a 100 km route completes 20 deliveries and the final 40 km carry no scheduled work. Fuel costs €19.16 at the stated inputs, equal to €0.958 per delivery.
Place five already-scheduled compatible stops along the return corridor. If they add 8 km, the route becomes 108 km and completes 25 deliveries. Fuel rises to €20.69, while fuel per delivery falls to €0.828, a 13.5% reduction. The additional five deliveries use €1.53 of fuel in this illustration.
The result depends on the actual addresses and time windows. A distant stop can erase the gain. The right comparison covers the complete plan for all scheduled work.
Run a seven-day empty-kilometre audit
- Record the start, every completed stop and the final return point for each route.
- Mark route legs that contain no delivery, collection or service event.
- Calculate empty share, kilometres per completed delivery and deliveries per route.
- Group compatible stops by geography and time window before allocating vehicles.
- Compare the planned total distance with the current manual baseline.
- Record failed stops separately so repeat work stays visible.
- Recalculate the direct fuel amount with the invoice price and each vehicle's consumption.
MileCut helps with the planning part of this audit. Upload the day's stops, review how they are allocated across vehicles, improve their order and share the resulting Google Maps links. Return demand must already exist. MileCut reveals whether the existing stops form a denser plan with fewer excessive kilometres.
To test this with your own scheduled stops, follow the Excel or CSV upload, route review and Google Maps handoff steps.
The useful outcome is a weekly operating number: empty kilometres removed while completed work stays the same or rises. That number turns route planning into a direct cost decision.
Sources and limits: Eurostat: Road freight transport by journey characteristics, 2025, Eurostat dataset road_go_ta_tott, Eurostat road freight methodology, Regulation (EU) No 70/2012, European Commission Weekly Oil Bulletin. Eurostat states that small goods vehicles below the applicable loading-capacity threshold are outside these road-freight statistics. The 27.2% share serves as a freight benchmark. Every van fleet needs its own measurement.
Measure the return leg before the next route leaves.
Upload the scheduled stops, review the allocation and compare planned kilometres with your current baseline.