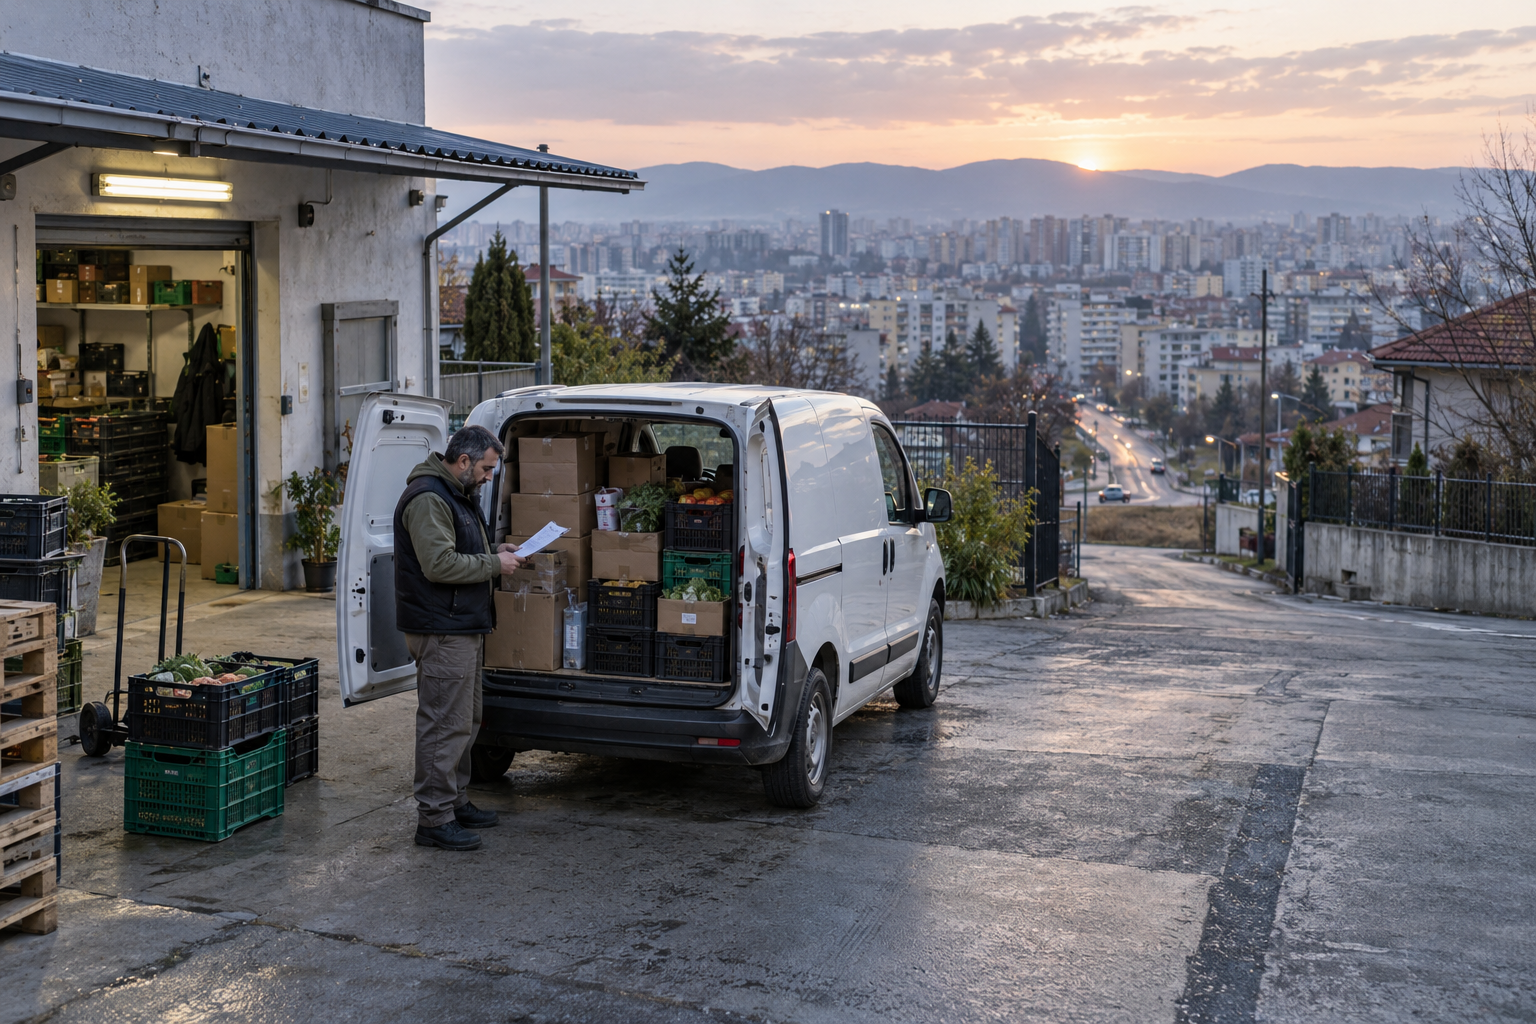
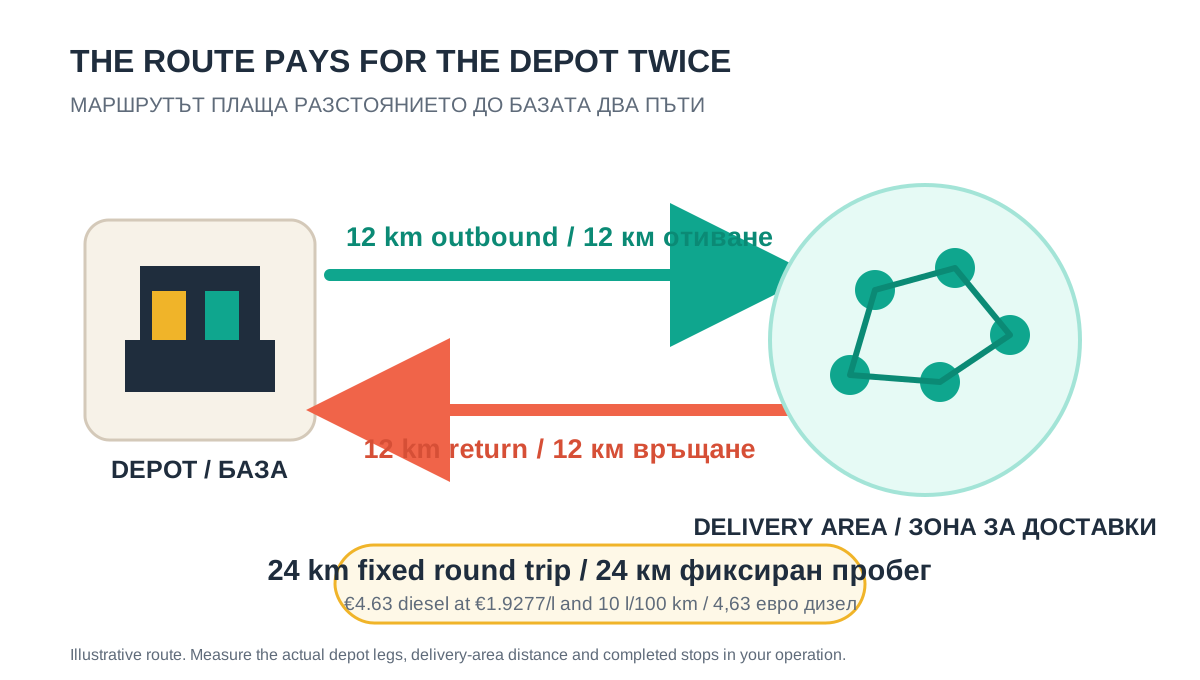
A van leaves a depot 12 kilometres from its delivery area. At Bulgaria's latest average diesel price, that one-way drive uses €2.31 of fuel for a van consuming 10 l/100 km. The return brings the fixed depot bill to €4.63, before counting a single kilometre between customers.
That cost can hide inside a route that looks busy. The cure is a simple split: measure the road to and from the delivery area separately from the kilometres used to serve customers inside it.
The route has a stem and a service area
A European Commission Joint Research Centre assessment uses this distinction. It describes effective tour distance as the road from the first to the last delivery stop. Actual tour distance also includes travel from and to the depot. The report's parcel inputs come from older external data, so its published averages are unsuitable as a Bulgarian small-business benchmark. The measurement method remains useful.
| Distance block | Worked example | Owner measure |
|---|---|---|
| Depot to first delivery area | 12 km | Start to first stop |
| Inside the delivery area | 28 or 34 km | First stop to last stop |
| Return to depot | 12 km | Last stop to end point |
| Whole route | 52 or 58 km | Start to end |
The split reveals two different decisions. Depot distance is often difficult to change today. Delivery-day planning can influence how many compatible stops share that distance and whether the business repeats the same journey tomorrow.
The fixed depot trip costs €4.63 in diesel
The latest European Commission bulletin available on 7 October reports Bulgarian automotive diesel at €1.9277 per litre for 28 September 2026. With an illustrative consumption of 10 l/100 km:
fuel cost per km = €1.9277 × 10 ÷ 100 = €0.19277
24 depot km × €0.19277 = €4.62648, rounded to €4.63
This is fuel only. Paid driving time, distance-based maintenance, tyres and depreciation belong in the full route cost when reliable company records exist. The fuel amount is the immediate, auditable floor.
Four deliveries carry €1.16 each. Twelve carry €0.39.
The same €4.62648 depot fuel bill becomes smaller per completed delivery as compatible work shares the route. Four completed deliveries carry €1.16 each. Eight carry €0.58. Twelve carry €0.39.
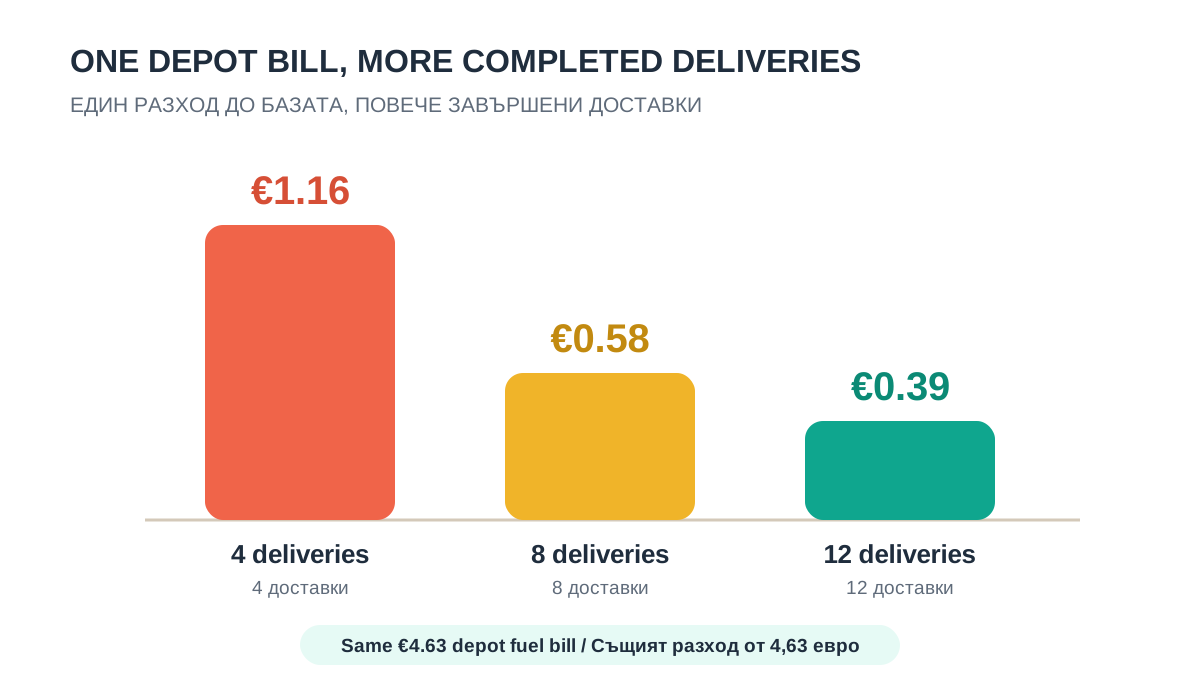
This calculation allocates cost and makes no prediction that every extra order creates a saving. A stop helps the route when geography, loading order, vehicle capacity and the promised service window are compatible. A remote order can add a new branch and raise cost sharply.
Six more kilometres can support four more deliveries
Consider two illustrative plans using the same depot and fuel inputs. The first route covers 52 km and completes four deliveries. Direct diesel is €10.02, or €2.51 per completed delivery. The second covers 58 km and completes eight compatible deliveries. Direct diesel rises to €11.18, while fuel per completed delivery falls to €1.40.
| Worked route | 4 deliveries | 8 deliveries |
|---|---|---|
| Total distance | 52 km | 58 km |
| Depot round trip | 24 km | 24 km |
| Direct diesel | €10.02 | €11.18 |
| Diesel per completed delivery | €2.51 | €1.40 |
Deliveries double, distance rises 11.5%, and fuel per completed delivery falls 44.2%. This scenario demonstrates the arithmetic of density. It reports no customer result and promises no fixed saving.
The fixed trip became 28.7% more expensive in eleven weeks
The Commission history workbook reports Bulgarian diesel at €1.4977 per litre on 13 July and €1.9277 on 28 September. The same 24 km depot round trip moved from €3.59 to €4.63 across those twelve weekly observations.
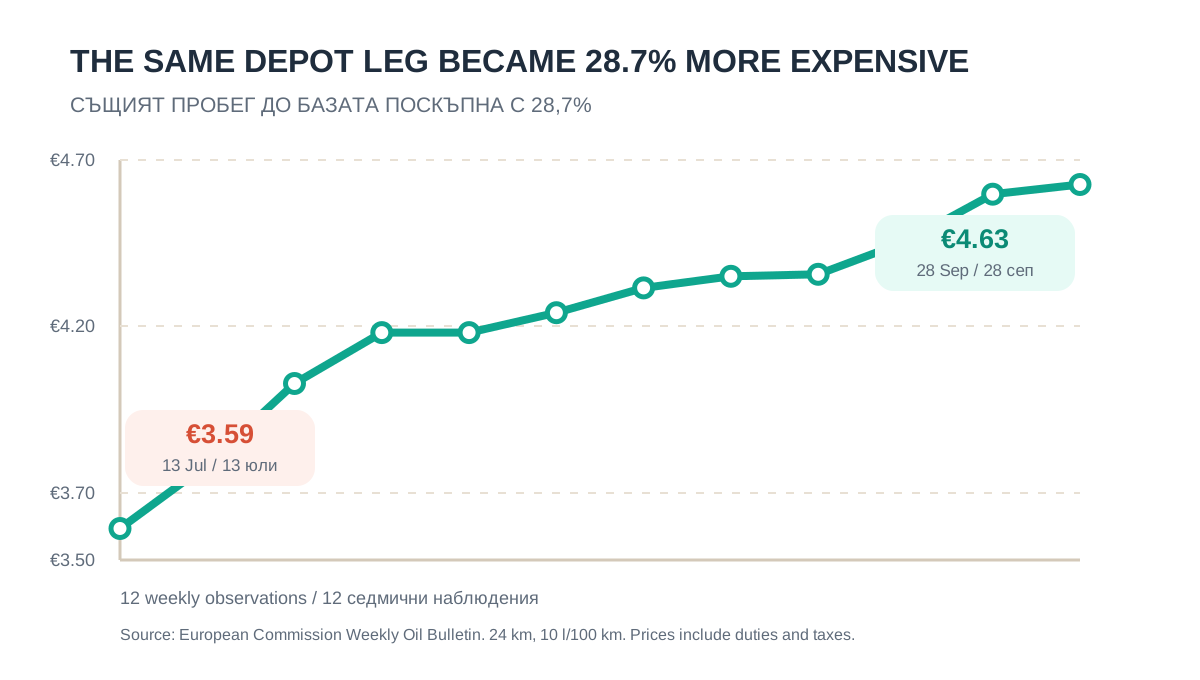
Fuel volatility changes the value of every repeated depot journey. The operating response is to update the price input weekly and examine whether compatible deliveries can share the journey. The business still needs to respect promised days, capacity and customer priorities.
Consolidation has evidence and limits
The European Commission identifies suburban logistics locations, high costs and low margins among the pressures facing urban freight. It points to vehicle optimisation and fewer unnecessary runs as useful responses. An EU-funded Athens food-distribution pilot reported travel-distance reductions from 9% to 48% across specific collaborative-distribution scenarios.
Those percentages belong to that pilot, its participants and its network. A small Bulgarian company should treat them as evidence that consolidation deserves testing, then measure its own routes. The useful local question is narrower: can work already promised to the same area share one depot journey?
A weekly depot-distance check
- Separate the kilometres. Record outbound depot distance, distance inside the delivery area and the return leg.
- Count completed work. Use completed deliveries, failed stops and repeat journeys as separate fields.
- Price the fixed trip. Multiply depot round-trip kilometres by actual litres per 100 km and the latest invoiced price per litre.
- Measure density. Track depot kilometres and total kilometres per completed delivery.
- Find compatible work. Review whether nearby deliveries on adjacent days can share a route without breaking customer commitments.
- Compare before dispatch. Check total planned distance and courier allocation before creating the final routes.
Where MileCut fits
MileCut starts with the address list the business already uses. Upload Excel or CSV, choose the start location and end point, review the pins, and create editable routes for one to five couriers. Team and Control can group work between couriers and let the owner move or reorder stops before departure.
Use MileCut to compare whether compatible deliveries can share the same route and whether a second courier creates overlapping depot travel. Then send the reviewed routes through separate Google Maps links. Record actual distance and completed stops after the day.
If one reviewed plan genuinely removes a second 24 km depot round trip while completing the same work, the example saves €4.63 in direct diesel at today's benchmark. Driver and vehicle savings should be added only when company records show those costs also fell.
Sources and limits: European Commission Weekly Oil Bulletin, European Commission JRC e-commerce assessment, European Commission urban freight guidance, EU Urban Mobility Observatory U-TURN case study. Current market data was checked on 7 October 2026. Calculations use an illustrative route and 10 l/100 km. Actual depot distance, price, consumption and delivery pattern vary.
Measure the route before the first stop.
Upload the next delivery list, set the start and end points, and compare depot kilometres per completed delivery.