Fuel is visible because the company receives a receipt. Its full cost is less visible because it spreads through the operating day.
For a small delivery or service business, a fuel-price increase has at least four effects.
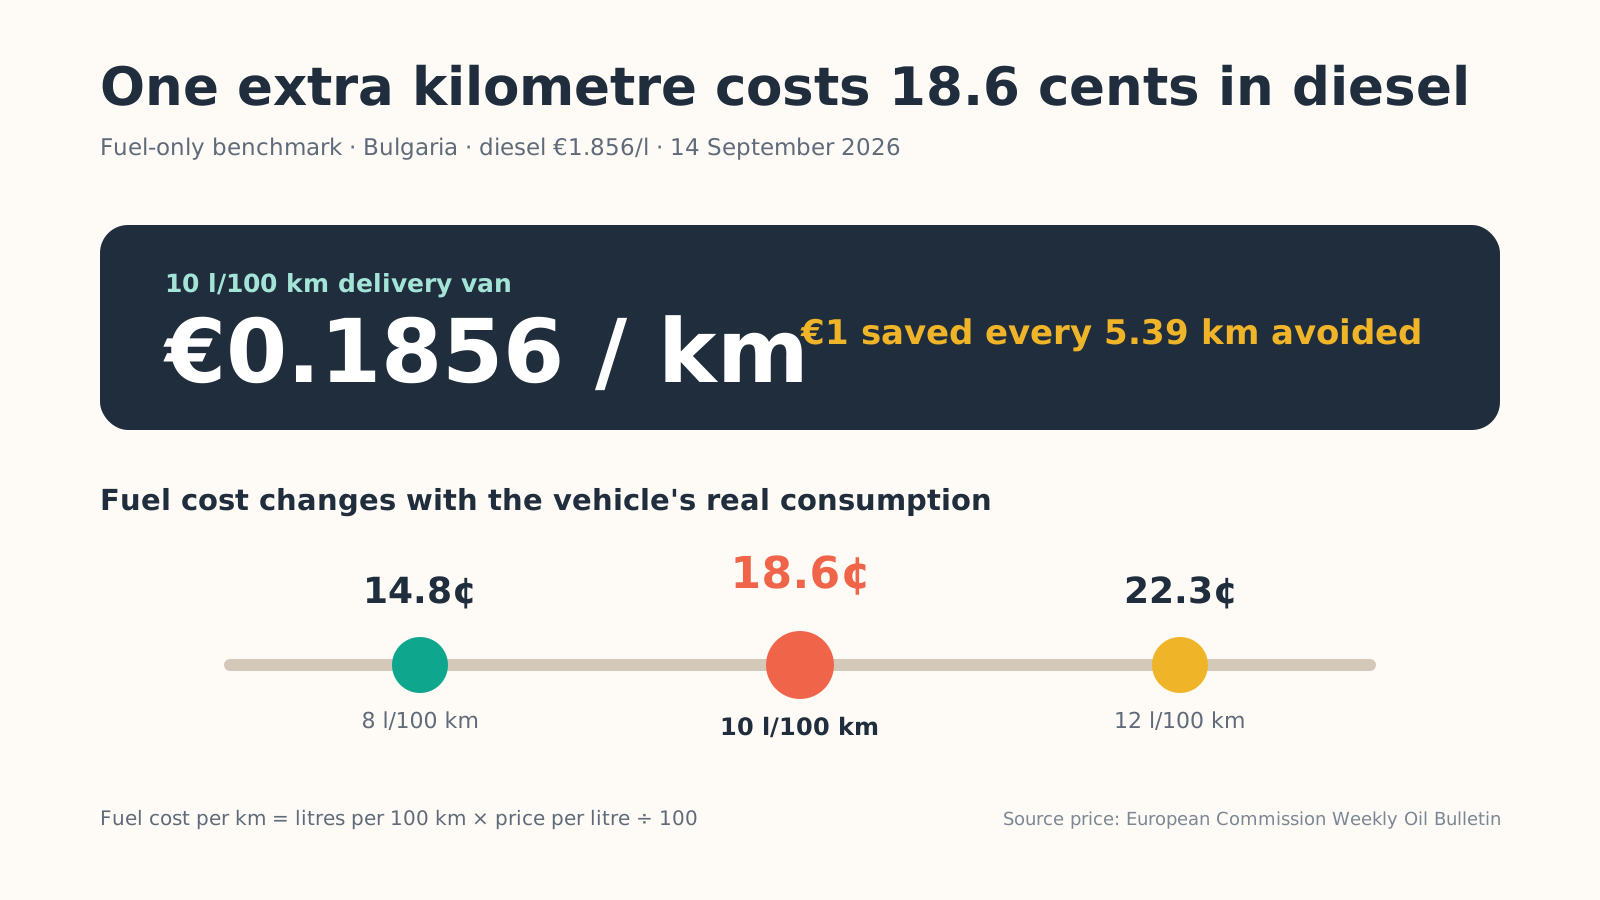
Fuel-cost example: €0.1856 per kilometre
The basic relationship is:
fuel cost = kilometres × litres per 100 km ÷ 100 × price per litre
For this article's example, checked on 23 September 2026, we use a Bulgarian diesel price of €1.856 per litre. A delivery van consuming 10 litres per 100 kilometres burns 0.1 litre over one kilometre. That kilometre therefore costs €0.1856 in fuel.
Every kilometre actually removed from a completed route creates a direct fuel saving at the same rate:
- 100 avoided kilometres save €18.56;
- 500 avoided kilometres save €92.80;
- 1,000 avoided kilometres save €185.60.
These amounts use that dated fuel-price input and a 10 l/100 km vehicle. Replace both inputs with the company's fuel invoice and measured vehicle consumption.
The full direct saving per kilometre
Fuel creates the immediate cash saving. Shorter routes can also reduce paid driving time, tyre use and distance-based maintenance. A practical company formula is:
direct saving per avoided km = fuel cost per km + variable vehicle cost per km + driver cost per hour ÷ actual route km per hour
Use actual payroll and vehicle records for the last two terms. Fixed costs enter the saving only when the route change removes a shift, rental or vehicle from the operation.
Route time turns distance into labour cost
Congestion, poor stop order and repeated crossings add paid time even when the distance difference looks small. A Madrid field study followed 242 real delivery routes and found that pedestrian crossings, traffic lights and congestion reduced average operating speed by as much as 57% in the city centre. It also found that the same type of diesel van consumed more fuel per kilometre in the city centre than in the peri-urban area because of low speeds and repeated stopping.
The Madrid study establishes a mechanism that each city should measure locally: time and fuel move together. A short route can still carry a higher cost when it creates more stop-start driving or misses delivery windows.
Capacity becomes less productive
Every unnecessary vehicle-hour occupies a van and a driver that could complete another stop or return earlier. A route that requires an extra vehicle can add a whole block of fixed and labour cost in addition to the fuel consumed.
Planning should therefore ask:
- Can the same work be completed with fewer vehicle-hours?
- Are routes balanced, or does one driver finish while another runs overtime?
- Are low-density stops being sent out at the wrong frequency?
- Are bad addresses and failed deliveries creating repeat trips?
More deliveries on one route change the unit economics
Route density should be measured directly:
deliveries per route = completed deliveries ÷ routes run
kilometres per delivery = total route kilometres ÷ completed deliveries
Consider a 100-kilometre route using the same 10 l/100 km van and €1.856/l diesel benchmark. Its fuel bill is €18.56. With 20 completed deliveries, fuel cost is €0.928 per delivery. With 25 compatible deliveries on the same route, it becomes €0.742 per delivery. Five additional deliveries reduce fuel cost per delivery by 20% in this illustration, while the total route distance remains unchanged.
MileCut helps the dispatcher test this operating lever before departure by allocating stops across vehicles and improving their sequence. The useful business comparison is the planned kilometres and deliveries per route against the current manual baseline.
Start with the delivery addresses already in your spreadsheet. See how to upload Excel or CSV, review the route and share Google Maps links, then compare the planned distance with your normal delivery day. Savings depend on your actual routes and vehicle costs.
Old prices can erase margin
The most dangerous fuel cost is the one missing from a quote. When a company sets a fixed delivery price using last quarter's fuel assumption, the increase is absorbed by its margin. Small companies often have less room to carry that gap and less bargaining power to reopen customer agreements.
Build a cost model that matches the operation
For each route or customer group, calculate:
route contribution = revenue - fuel - driver time - vehicle cost - tolls - other direct route costs
Then monitor four ratios:
- kilometres per completed stop;
- driver-hours per completed stop;
- fuel cost per completed stop;
- contribution per route or customer group.
This reveals whether the problem is the market price, the route design, low stop density, unreliable addresses, waiting time or an underpriced contract.
A robust cost model absorbs fuel volatility through regular updates. Refresh its fuel input weekly, review customer profitability monthly and use an agreed rule for when quotes or surcharges change.
Sources: European Commission: Weekly Oil Bulletin, Madrid real-route study: 242 delivery routes, Eurostat: 99% of EU enterprises were micro or small in 2023, Bulgarian NSI: 2025 expenditure by enterprise size and activity.
Measure the next route before it leaves.
Upload real stops, review the plan and compare it with your current baseline.