Two Vans, Twelve Stops: A Bad Split Adds 32 Kilometres

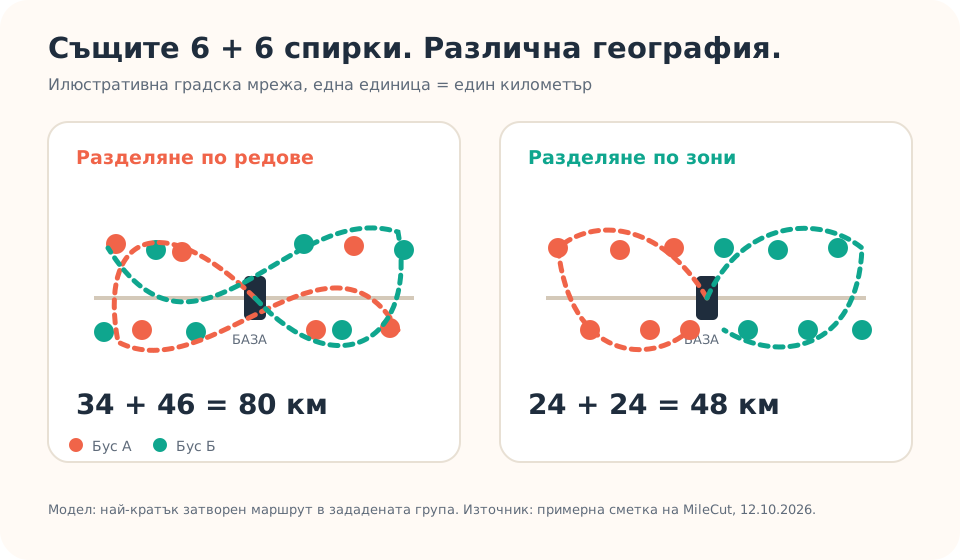
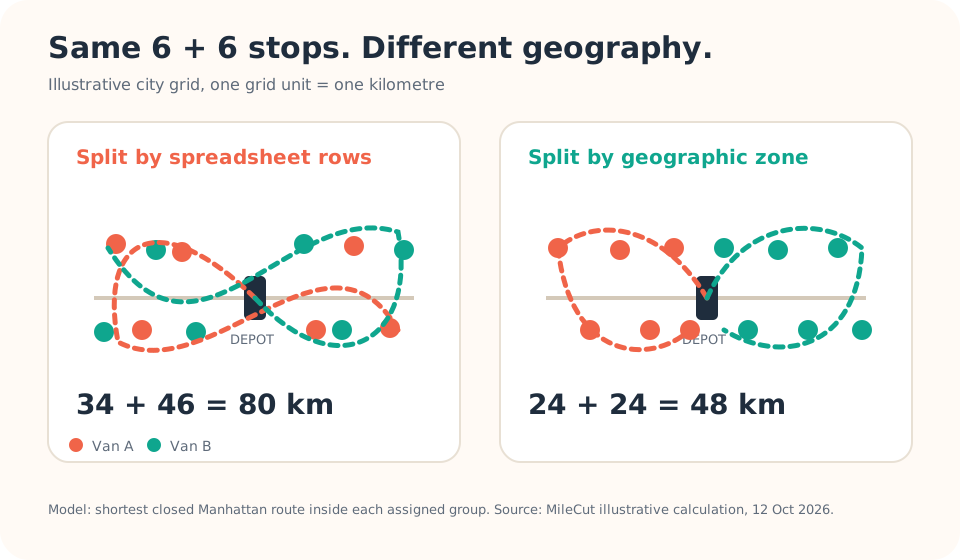
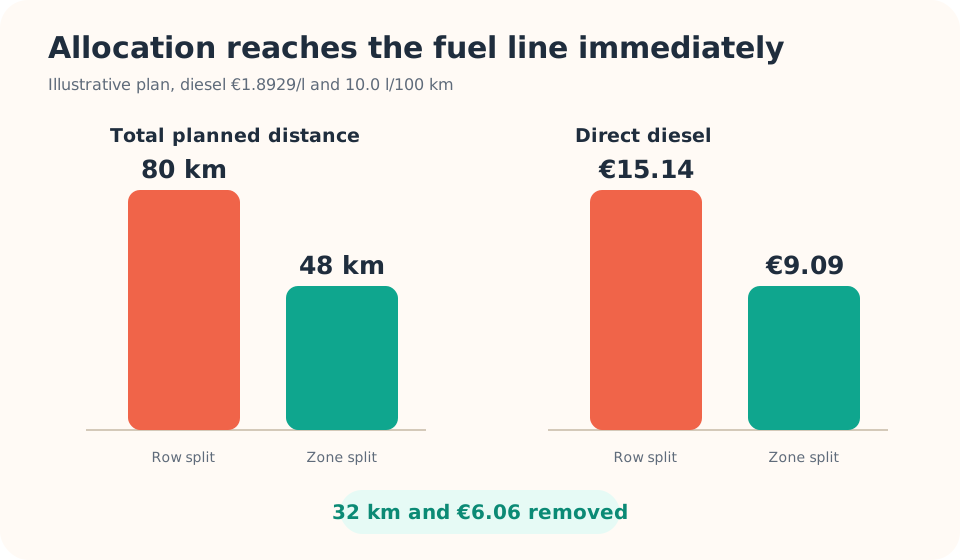
Dividing twelve deliveries into six stops for each van looks balanced. In a reproducible city-grid example, that simple split produces 80 planned kilometres. Grouping the same stops by geographic zone produces 48 km. Two vans still leave the depot and all twelve deliveries remain in the plan.
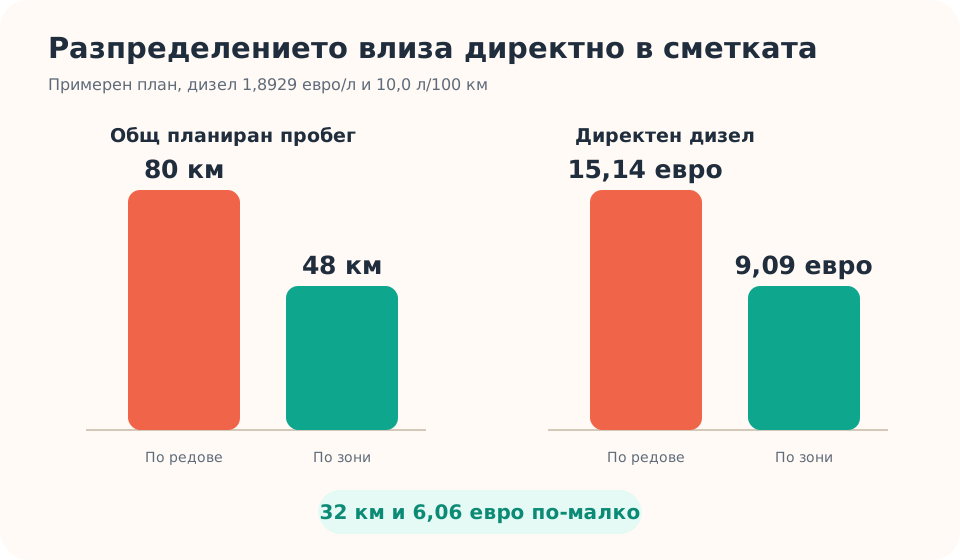
The difference is 32 km. At Bulgaria's latest average diesel price and 10.0 l/100 km, those kilometres carry €6.06 of direct fuel. If the same allocation error repeats on 22 comparable days, the illustrative fuel exposure reaches €133.26.
Equal stop counts can hide crossed routes
The fictional list contains six addresses east of the depot and six west of it. The spreadsheet alternates east and west rows. Giving the first six rows to van A and the next six to van B sends both vehicles across the full area.
The geographic version gives one zone to each van. Both versions assign six stops to each vehicle. Every assigned group is then sequenced with the same method: all 720 possible orders for its six stops are compared, and the shortest closed route is used.
| Illustrative allocation | Van A | Van B | Total |
|---|---|---|---|
| First six rows, next six rows | 34 km | 46 km | 80 km |
| West zone, east zone | 24 km | 24 km | 48 km |
| Difference | -10 km | -22 km | -32 km |
The shorter plan uses 40.0% fewer kilometres. That percentage belongs to this grid and these coordinates. The useful practice is to compare the fleet total before dispatch rather than treating an equal stop count as proof of an efficient split.
One extra kilometre costs €0.18929 in fuel today
The European Commission's latest Weekly Oil Bulletin release is dated 8 October. Its Bulgaria observation for 5 October reports automotive diesel at €1.8929 per litre including duties and taxes.
fuel per km = €1.8929 × 10.0 l/100 km ÷ 100 = €0.18929
The row split therefore uses €15.14 of diesel in the model. The zone split uses €9.09. Direct fuel falls by €6.06 because 32 km disappear while the completed work remains unchanged.
Driver time, maintenance, depreciation and vehicle finance remain outside the €6.06. Add them only when company records show how they change. Moving kilometres from one van to another also creates no fleet saving. The total has to fall.
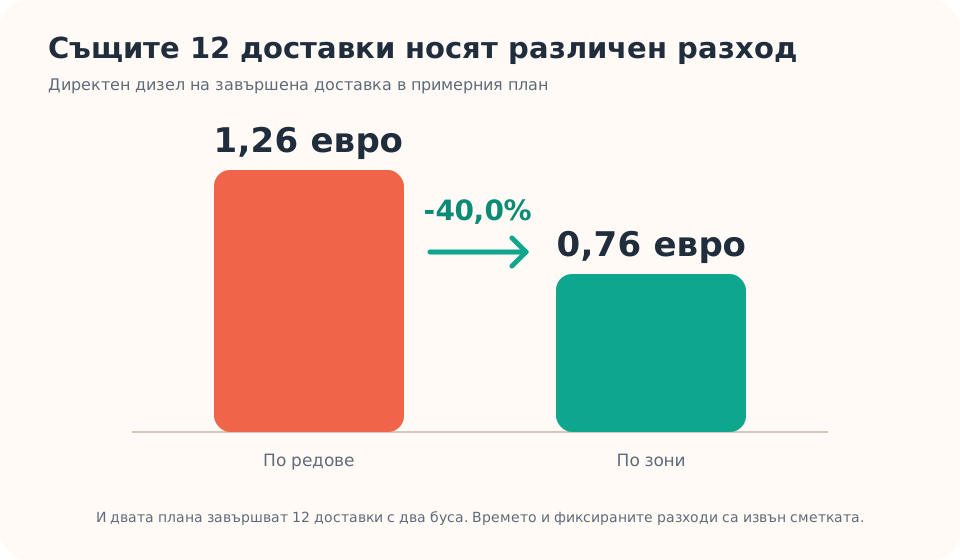
The cost per delivery falls from €1.26 to €0.76
Both plans complete twelve deliveries. Dividing direct fuel by completed work reveals the unit economics:
fuel per completed delivery = total km × fuel per km ÷ completed deliveries
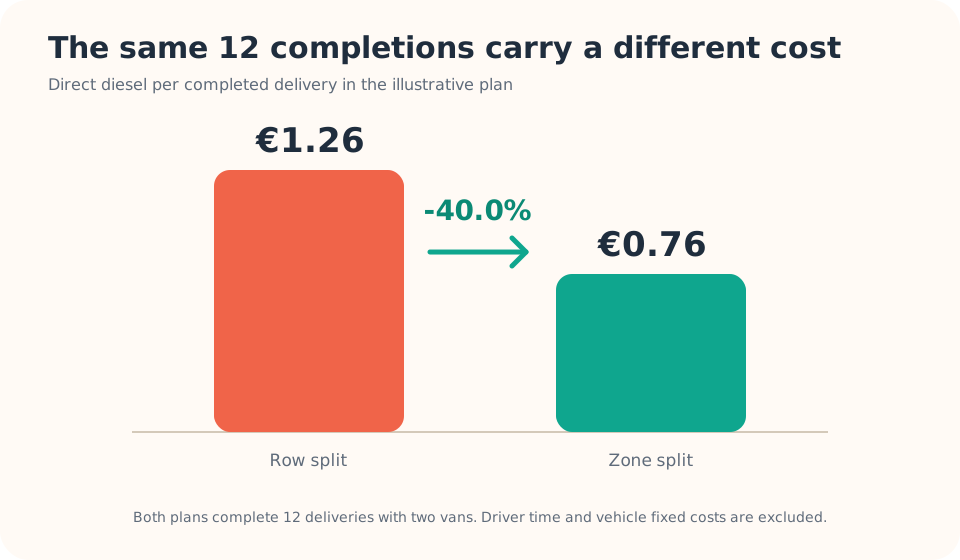
Density improves when compatible stops share existing route kilometres. A full van can still be poorly allocated. A slightly longer route can still improve cost per delivery when it completes enough nearby work. Track both total distance and completed deliveries.
A second van has a fixed cost
The comparison assumes two vans are already required by capacity, delivery windows or working hours. Starting another vehicle can add driver time, preparation, insurance exposure, depreciation and a fixed operating cost. A route split should earn its place in the plan.
Google's current Route Optimization documentation separates fixed vehicle cost, cost per kilometre, cost per hour and cost per travelled hour. It also treats load balancing, capacity and time windows as distinct decisions. This is a useful checklist even when a small business uses a simpler planning tool.
A fair workload may need unequal stop counts. Six apartment deliveries with long service times can carry more work than eight quick shop drops. Compare the longest route, expected finish time, load and promised windows beside the fleet total.
A six-step owner check before dispatch
- Keep one complete list. Review all addresses together before splitting them between couriers.
- Add the constraints. Record capacity, service time, priority, promised windows and vehicle restrictions that change assignment.
- Group compatible geography. Keep nearby work together when timing, loading order and capacity allow it.
- Compare fleet totals. Read total kilometres, the longest route, estimated duration and completed deliveries for the whole plan.
- Inspect crossings. Look for vans entering the same area, passing the same corridor or returning through another vehicle's zone.
- Measure the day. Record actual kilometres, finish time, completed stops, failed visits and the reason for every manual route change.
Use a two-week comparison with similar order counts and service areas. The primary measures are kilometres per completed delivery, fuel per completed delivery, vehicle-hours per completion and the longest route. Keep failed or cancelled stops visible so they do not improve the denominator.
Where MileCut fits
MileCut starts with the address list the company already uses. Upload Excel or CSV, choose one to five couriers and review the proposed allocation and stop order on the map. Team and Control allow the planner to move stops between couriers and reorder them before creating routes.
Compare the total planned kilometres and each individual route. Use local knowledge to correct access, loading and customer issues. Then send each courier a separate Google Maps link. Continuous vehicle tracking and automatic replanning during the shift remain outside the current product.
If a revised allocation genuinely removes 32 km from completed work, the model's direct fuel calculation is immediate. The business should validate its own result with actual route and fuel records.
Sources and limits: European Commission Weekly Oil Bulletin, Google Maps Platform Route Optimization overview, Google Maps Platform cost model, Google OR-Tools Vehicle Routing. Sources were checked on 12 October 2026. The grid, route assignments and monthly extension are illustrative. Actual roads, vehicles, prices, loads, time windows and service times differ. This article does not claim that MileCut uses Google's Route Optimization API.
Compare the fleet total before the vans leave.
Upload the next address list, review the allocation and check the planned kilometres per completed delivery.