Bulgaria's Short-Haul Freight Jumped 25%. Can Local Routes Carry More Work?
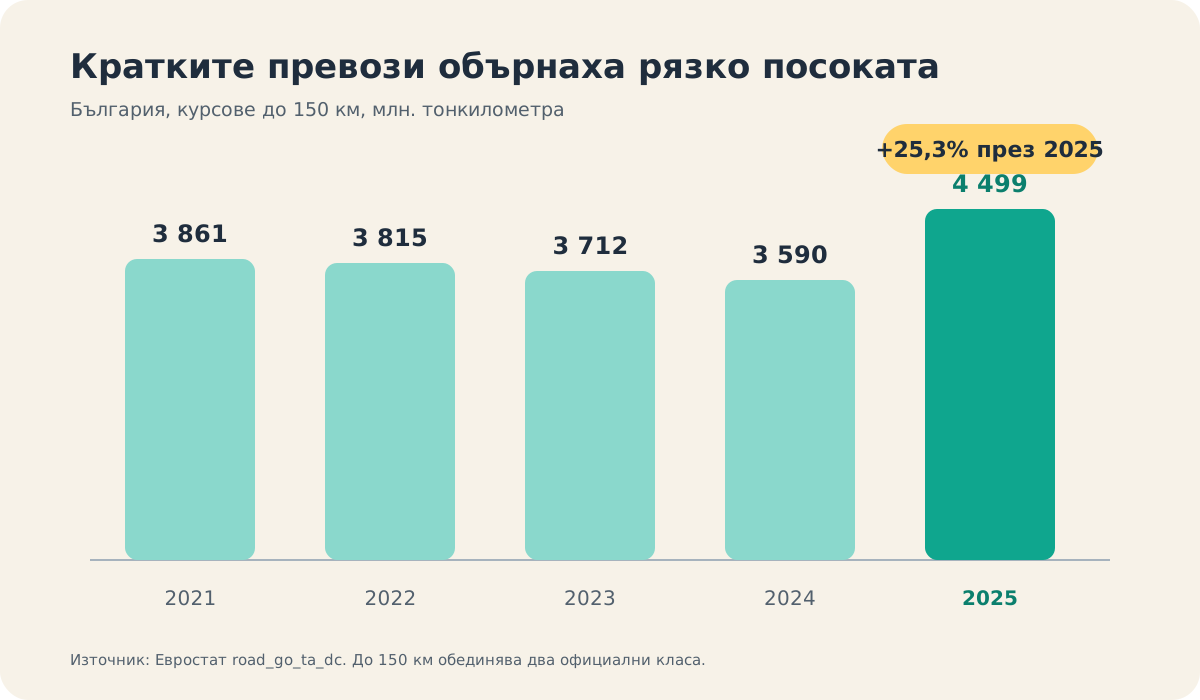
Bulgaria recorded an unusually sharp rise in short-haul freight work in 2025. Tonne-kilometres on journeys under 150 km increased by 25.3% in one year. The EU increase was 2.5%.
The statistic deserves a careful reading. It measures freight weight multiplied by distance for vehicles covered by national road-freight surveys. It does not count van routes, online orders or small-company deliveries. National survey thresholds can exclude many light vehicles.
Four years of decline ended with a 909 million tonne-km rise
Bulgaria's under-150 km road-freight performance fell from 3,861 million tonne-kilometres in 2021 to 3,590 million in 2024. It then rose to 4,499 million in 2025. That puts the 2025 level 16.5% above 2021.
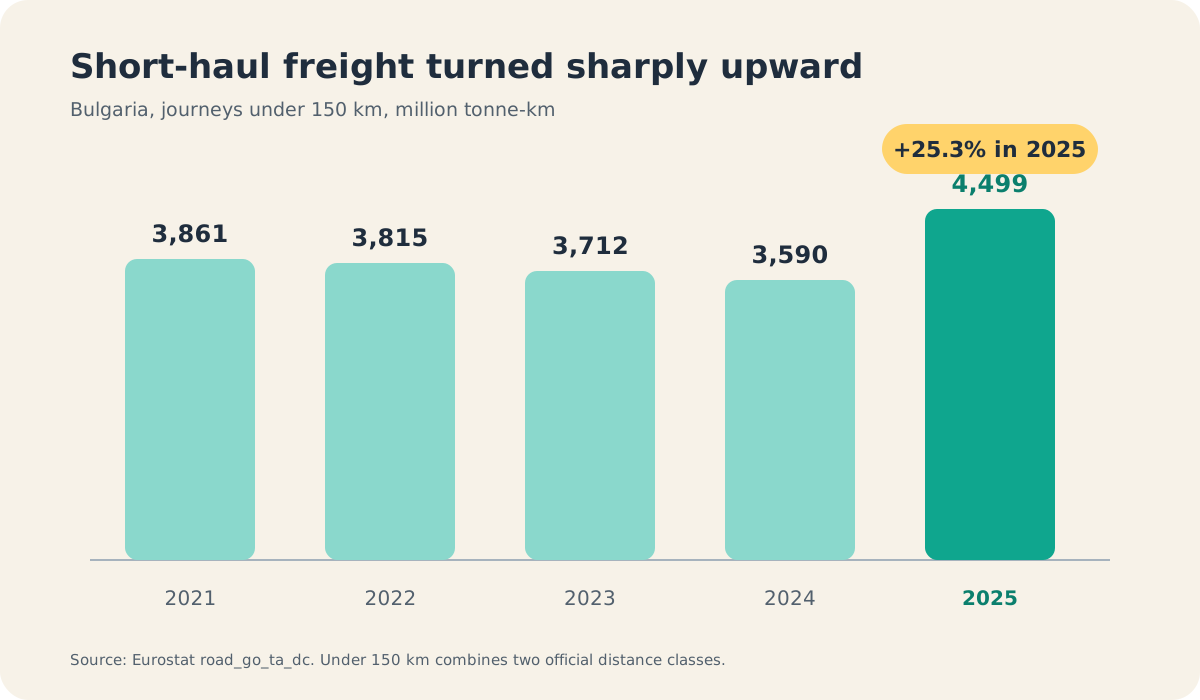
Bulgaria's total road-freight performance barely moved: 26,969 million tonne-kilometres in 2024 and 26,978 million in 2025. Short-haul work grew inside an almost unchanged total. Its share rose from 13.31% to 16.68%. Calculated from the unrounded shares, the increase was 3.36 percentage points.
That is a change in the national freight mix. It does not identify the cause. Commodity mix, customer geography, construction activity, operators covered by the survey and shipment weight can all affect the result.
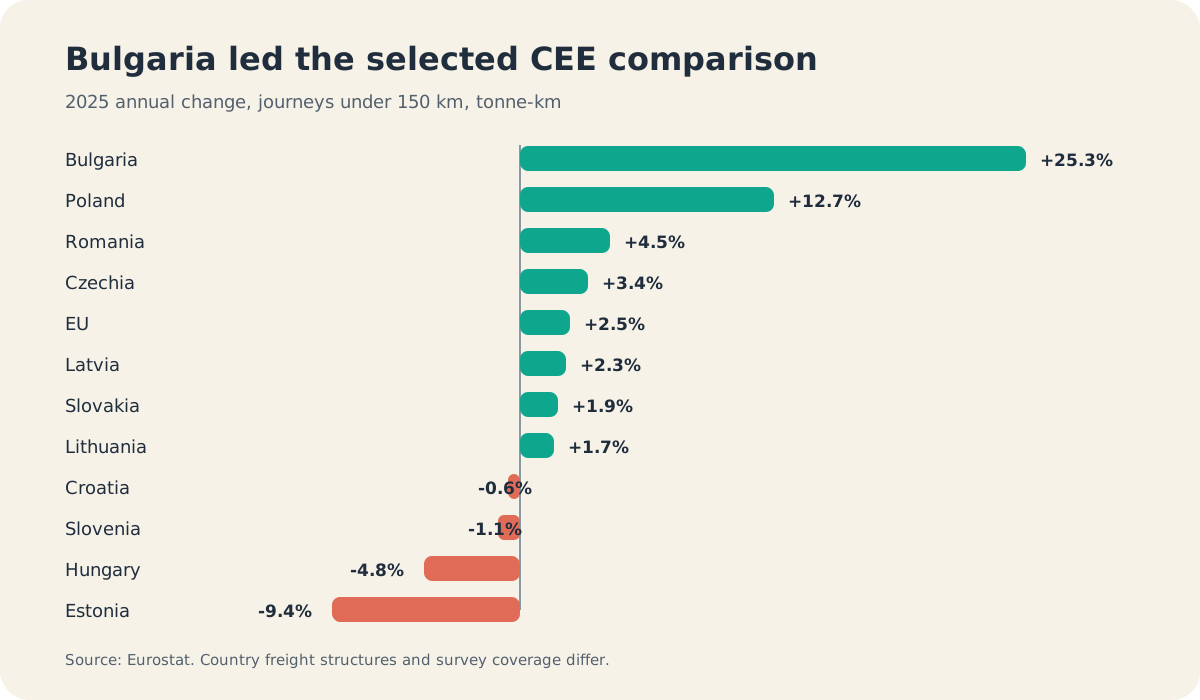
Bulgaria moved faster than the selected CEE markets
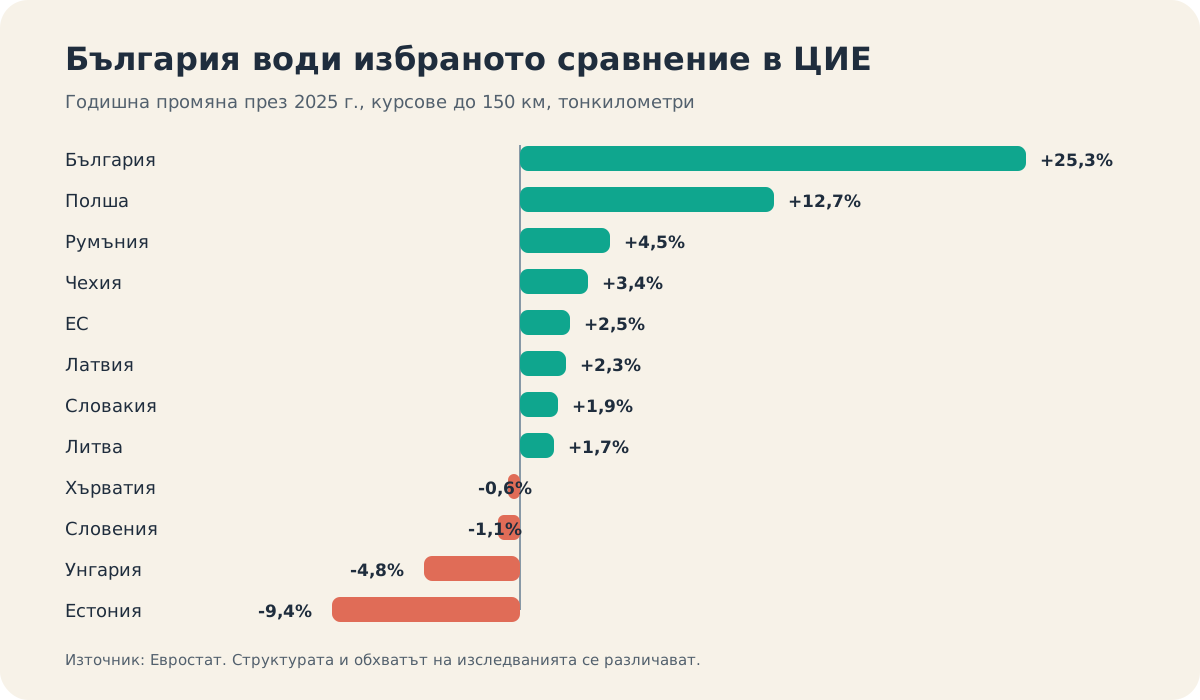
Poland's under-150 km freight performance rose 12.7% in 2025. Romania added 4.5% and Czechia 3.4%. Hungary fell 4.8% and Estonia fell 9.4%. Country structures and survey coverage differ, so the comparison shows market direction. Delivery productivity requires company records.
One extra kilometre costs €0.189 in diesel today
The European Commission bulletin published on 29 October reports Bulgarian automotive diesel including taxes at €1.8902 per litre for the 26 October observation. For a van consuming an illustrative 10.0 l/100 km:
fuel per km = 10.0 ÷ 100 × €1.8902 = €0.18902
The same 18 deliveries can use 108 km or 90 km
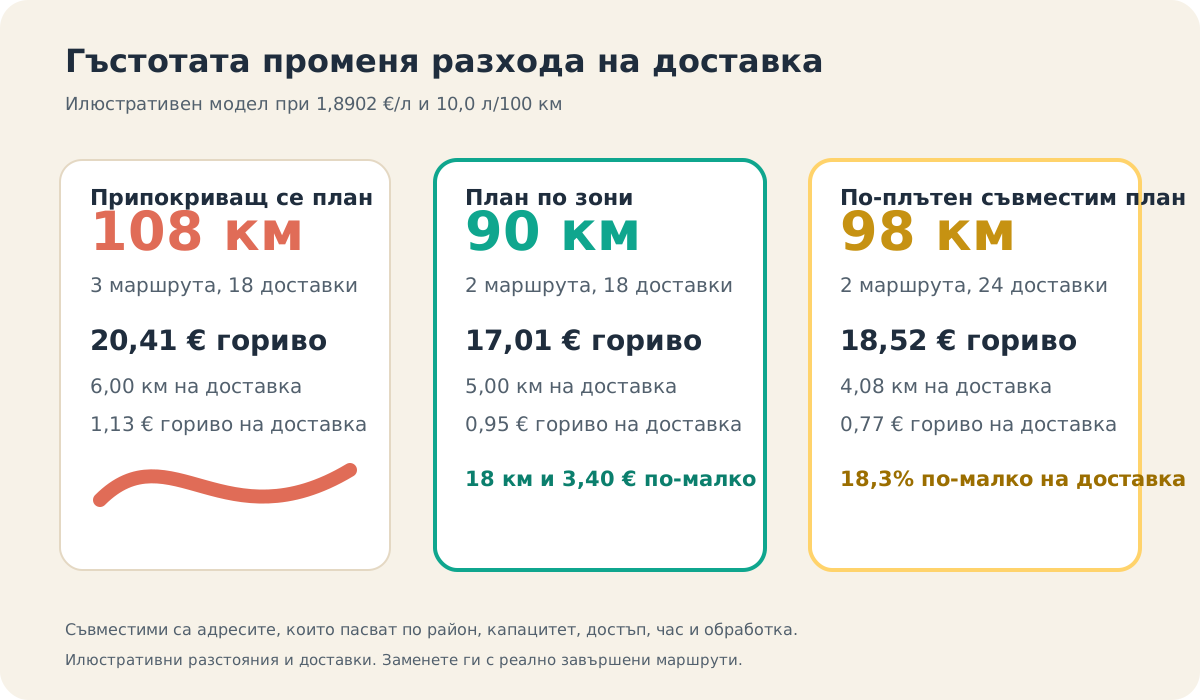
Consider an illustrative day with 18 compatible deliveries. Assigning them as they arrive creates three overlapping local routes covering 108 km. Grouping the complete list by zone creates two routes covering 90 km.
| Measure | Overlapping plan | Zone-based plan | Change |
|---|---|---|---|
| Completed deliveries | 18 | 18 | Same work |
| Total distance | 108 km | 90 km | -18 km, or -16.7% |
| Km per completed delivery | 6.00 | 5.00 | -16.7% |
| Direct diesel | €20.41 | €17.01 | -€3.40 |
The direct diesel difference is €3.40. Call it a saving only when the company genuinely removes 18 km and still completes all 18 deliveries. Labour, tyres and vehicle-use savings belong in the calculation only when company records show those costs fell.
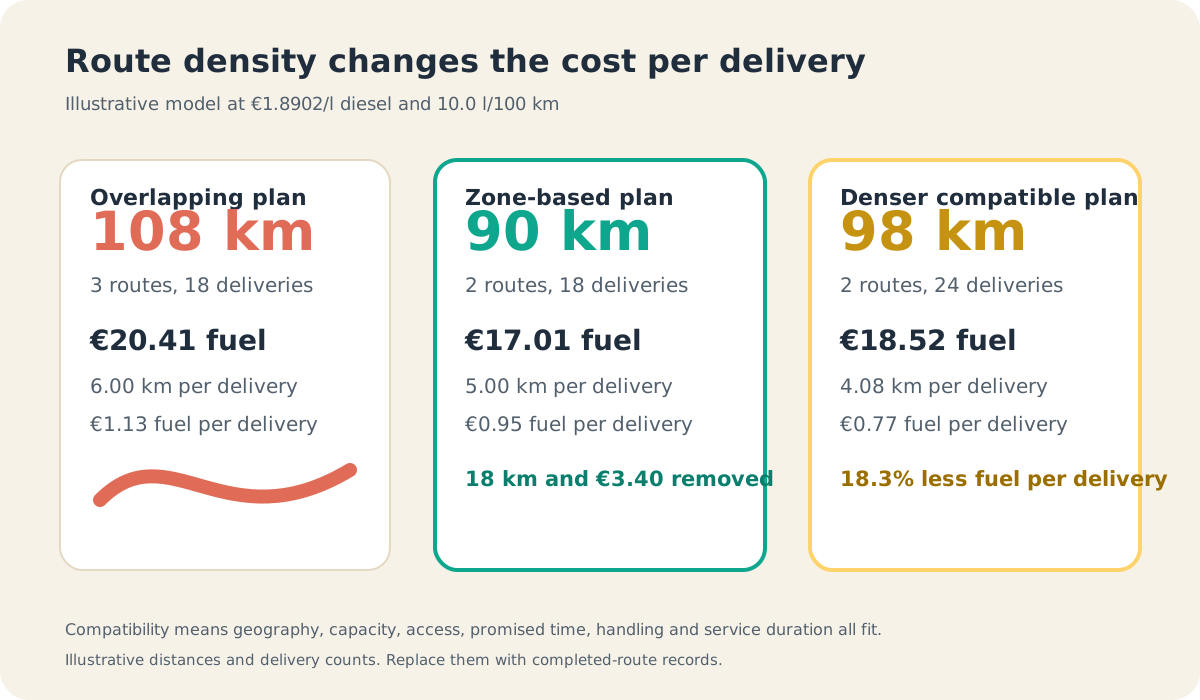
Six compatible deliveries can lower fuel per delivery by another 18.3%
Add six deliveries that fit the same two zones, vehicle capacity, access, promised times and handling rules. The two routes grow from 90 km to 98 km and complete 24 deliveries. Total diesel rises from €17.01 to €18.52 because the vans travel farther.
Fuel per completed delivery falls from €0.95 to €0.77, a reduction of 18.3%. The owner has spent €1.51 more on fuel and completed six more deliveries. Revenue, gross margin and service time still decide whether the added work is worthwhile.
Audit the local route before buying more capacity
- Tag every stop by zone and promise. Record area, promised time, service requirement and access constraint before assigning a vehicle.
- Set a planning cutoff. Build the first allocation from the complete list available at a defined time. Deal with late orders through an explicit rule.
- Compare every route together. Look for couriers crossing the same corridor, returning to a zone or leaving the depot partly used.
- Check operational fit. Capacity, loading order, handling, driver skills and customer requirements can separate nearby deliveries.
- Reconcile the day. Record planned and actual kilometres, completed deliveries, failed stops, fuel and the reason for each deviation.
Track kilometres and fuel per completed delivery beside total route cost. A lower ratio is useful only when service quality, margin and safety remain acceptable.
Where MileCut fits
MileCut lets an owner upload a CSV, XLS or XLSX delivery list, review the stops, select one to five couriers, adjust the proposed allocation and create Google Maps links. That shared view can expose route overlap and help compatible deliveries stay in the same zone.
MileCut currently does not enforce vehicle capacity, service duration, time windows, loading sequence or legal operating limits. The dispatcher remains responsible for these checks and for confirming that every route can be completed safely.
Sources and limits: Eurostat journey characteristics, Eurostat dataset road_go_ta_dc, European Commission Weekly Oil Bulletin, and MileCut guide. Sources were checked on 4 November 2026. Eurostat figures describe covered road-freight vehicles and may exclude light vans. The route distances, delivery counts and consumption in the business model are illustrative. Use actual invoices, measured consumption and completed-route records for decisions.
Put the full local delivery list on one planning screen.
Keep compatible stops together, compare courier distances and review every route before dispatch.