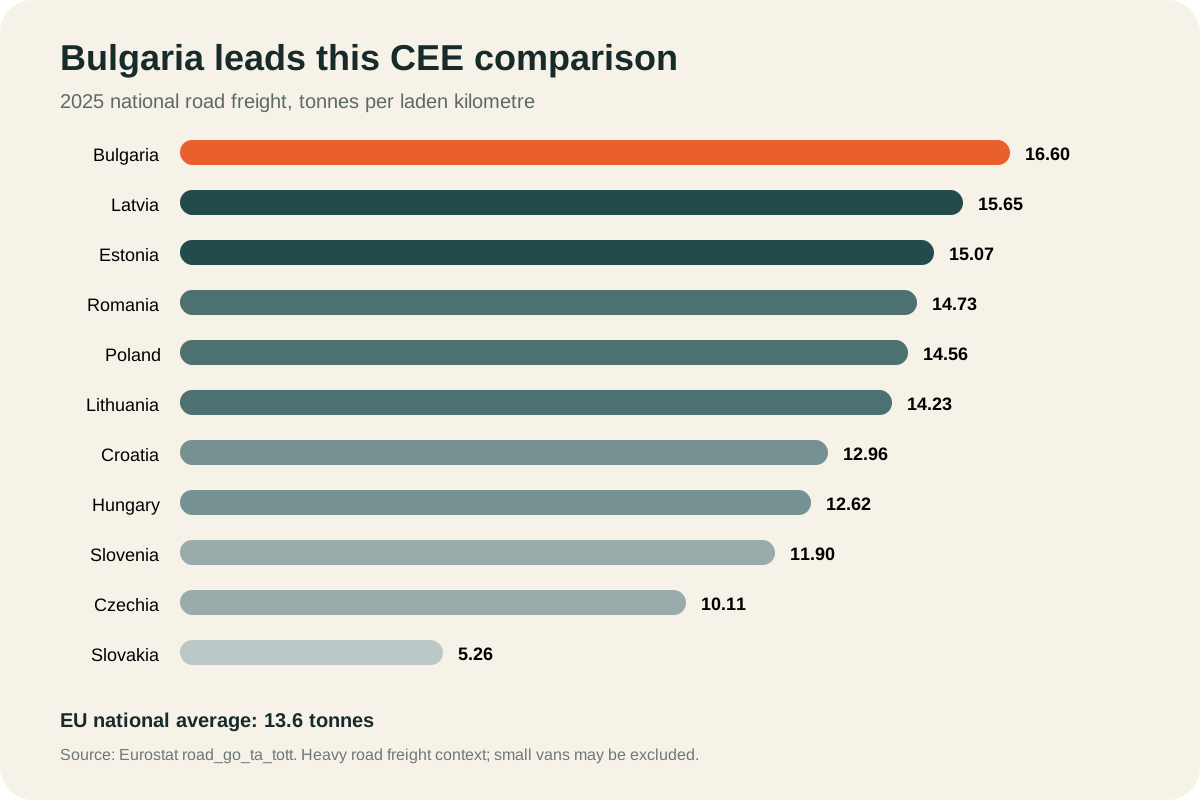
Bulgaria recorded the EU's second-highest average load for national road freight in 2025: 16.6 tonnes per laden kilometre. The EU average was 13.6 tonnes. That difference sounds like a lesson in using every vehicle well.
A small delivery company needs one important boundary around the figure. Eurostat's road-freight statistics can exclude vehicles below national thresholds, including many light vans. The 16.6 tonnes describes heavy freight activity. It gives market context and does not tell an owner how much one van can carry tomorrow.
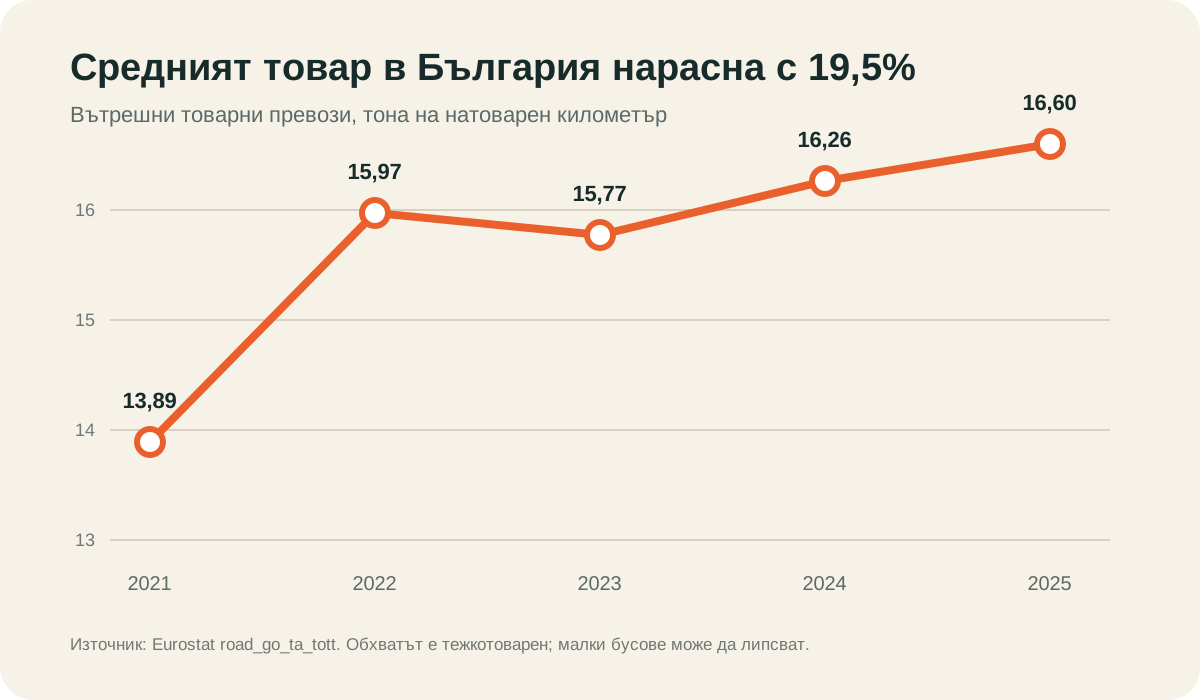
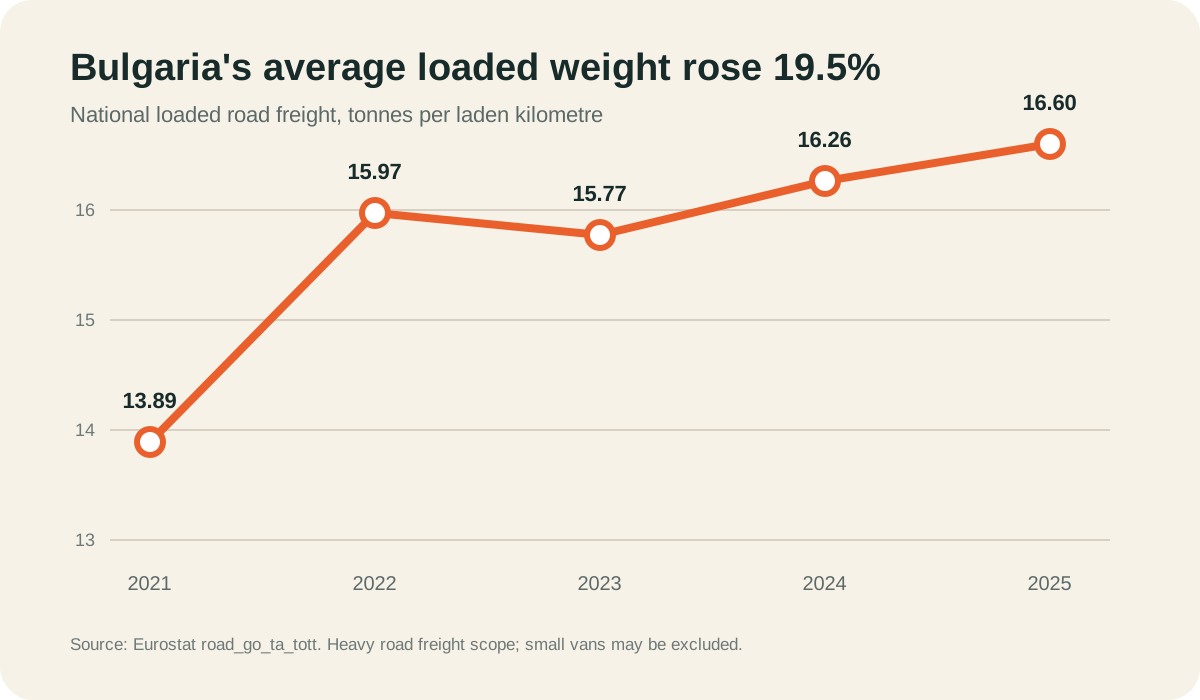
Bulgaria's average load rose 19.5% in four years
Eurostat defines average load as annual tonne-kilometres divided by the laden vehicle-kilometres that produced them. Bulgaria's national figure rose from 13.89 tonnes in 2021 to 16.60 tonnes in 2025. The increase does not prove that each vehicle became 19.5% fuller. Freight mix, vehicle mix, trip length and the surveyed operators can all move the average.
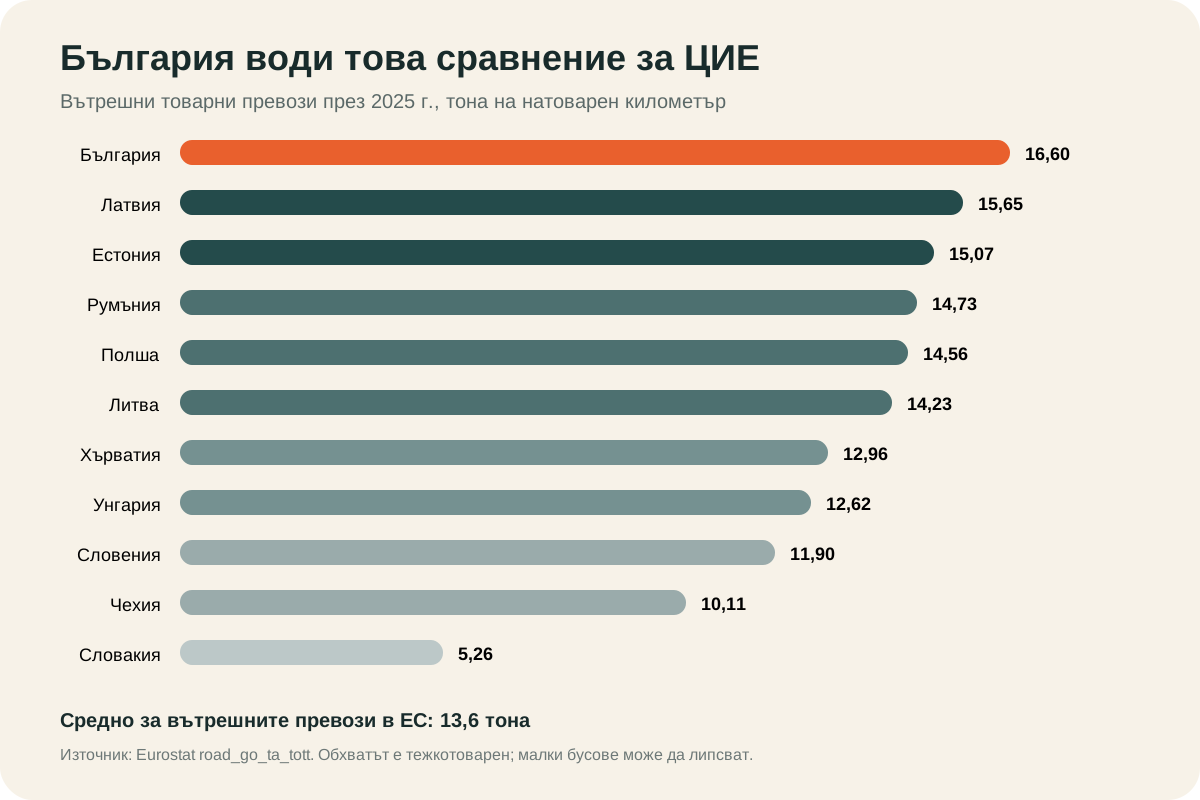
One region, very different load patterns
The selected CEE markets ranged from 5.26 tonnes in Slovakia to 16.60 tonnes in Bulgaria in 2025. National freight structures differ. Construction, manufacturing, agriculture, domestic trip length, international activity and the vehicles covered by each survey all influence the result.
Capacity has more than one unit
Weight is only the first gate. A route can remain below the payload limit and still fail because the boxes fill the cargo volume, a fragile order cannot sit underneath another, chilled and ambient goods need separate conditions, or the first delivery is trapped behind the last one.
Official route-modelling documentation describes capacity with matching load types, such as weight, volume or pallet count. The same idea works in a spreadsheet:
- Define usable limits for every vehicle. Record kilograms, cubic metres, pallet positions or another real operating unit.
- Record every order in the same units. Use measured or consistently estimated weight and volume. Mark special handling separately.
- Test the peak load. For a delivery-only route, the vehicle normally starts at its highest load. Mixed pickups and deliveries require a running balance after every stop.
- Check compatibility. Time promise, access, temperature, fragility, loading order, service duration and driver skills can prevent two nearby jobs from sharing a route.
- Reconcile the completed day. Record actual kilometres, completed stops, failures and the reason for every additional trip.
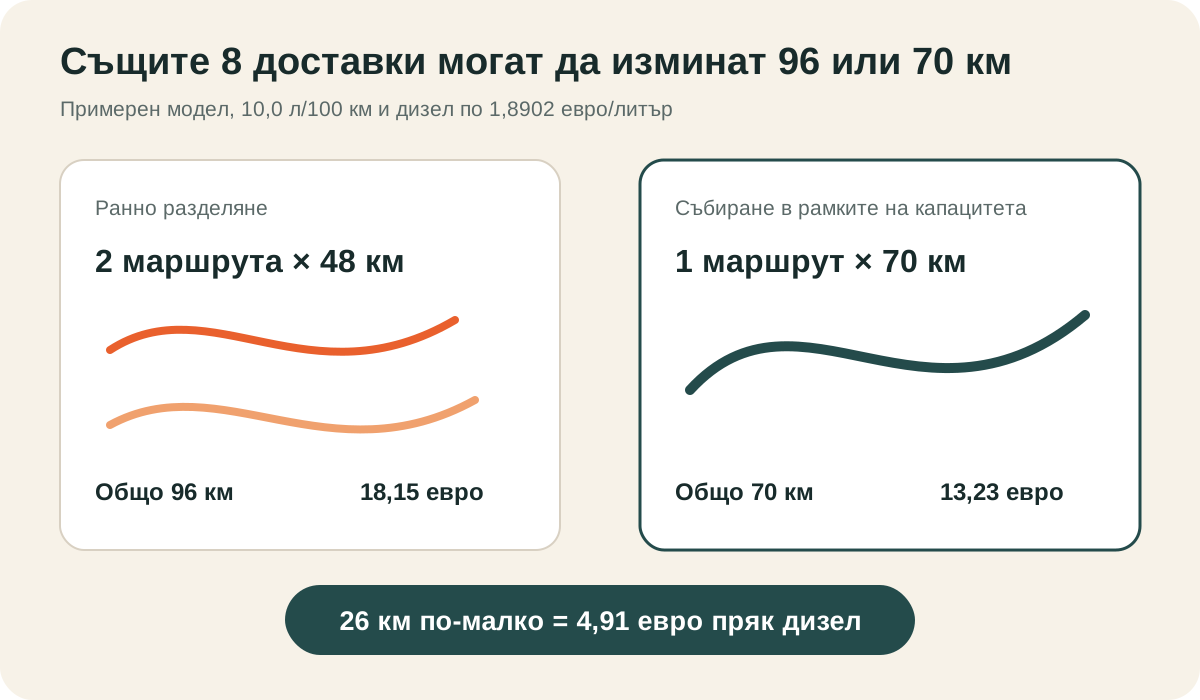
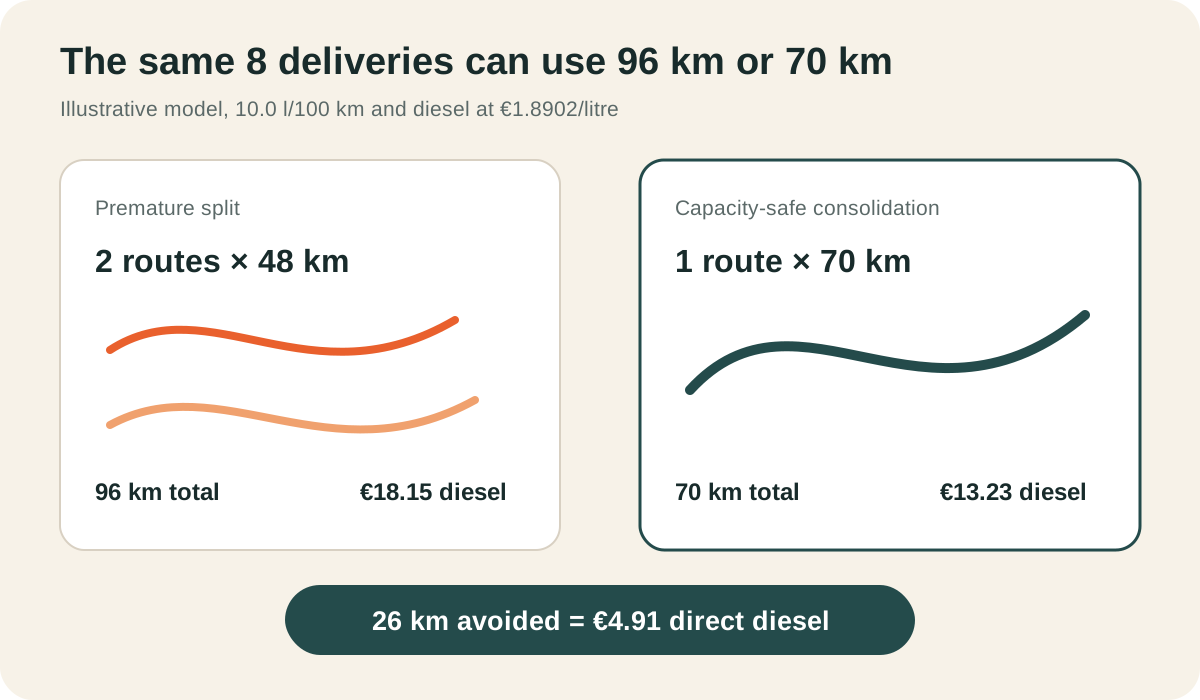
The same eight deliveries can use 96 km or 70 km
Consider an illustrative van with usable limits of 1,000 kg and 8.0 cubic metres. Eight deliveries total 640 kg and 4.4 cubic metres. They also fit the same area, service promises and handling requirements.
An early manual split sends two vehicles on 48 km routes, 96 km in total. A complete capacity check shows that all eight deliveries fit one 70 km route. The company removes 26 km, or 27.1% of the starting distance, while completing the same work.
| Measure | Two sparse routes | One capacity-safe route | Change |
|---|---|---|---|
| Completed deliveries | 8 | 8 | Same work |
| Total distance | 96 km | 70 km | -26 km, or -27.1% |
| Km per completed delivery | 12.00 | 8.75 | -27.1% |
| Direct diesel | €18.15 | €13.23 | -€4.91 |
One extra kilometre costs €0.189 in diesel today
The European Commission bulletin published on 29 October reports tax-inclusive Bulgarian automotive diesel at €1.8902 per litre for the 26 October observation. With illustrative consumption of 10.0 l/100 km:
fuel per km = 10.0 ÷ 100 × €1.8902 = €0.18902
Call €4.91 a saving only when the company genuinely removes those 26 km and still completes all eight deliveries. A second vehicle may remain necessary for weight, volume, time, access, temperature, loading order or resilience. Labour and vehicle-use savings belong in the calculation only when company records show they fell.
A denser route can use more fuel and cost less per delivery
Now add four compatible deliveries. The load becomes 900 kg and 6.8 cubic metres, within the illustrative limits. If the route grows from 70 km to 78 km, total diesel rises from €13.23 to €14.74. The van travels farther and completes 50% more deliveries.
Diesel per completed delivery falls from €1.65 to €1.23, a 25.7% reduction. Weight utilization rises from 64% to 90%, while volume utilization rises from 55% to 85%. The extra stops still use service time, and their revenue and margin still need to cover that work.
Where MileCut fits
MileCut lets the owner upload the delivery list, review stops on the map, select one to five couriers, adjust the proposed allocation and create Google Maps links. That view helps reveal overlapping routes, a distant stop and a vehicle split made before the full list was ready.
Add weight, volume and handling fields to the dispatch process before using the map. Keep together only the deliveries that pass the capacity and compatibility checks. Then compare planned kilometres and completed deliveries for every courier.
MileCut currently does not enforce payload, volume, pallets, time windows, temperature, service duration or loading sequence. The business remains responsible for those checks and all legal vehicle limits.
Sources and limits: Eurostat road freight statistics, Eurostat dataset road_go_ta_tott, Eurostat methodology, Google load-demand documentation, European Commission Weekly Oil Bulletin, and MileCut guide. Sources were checked on 30 October 2026. Eurostat averages describe covered road-freight vehicles and may exclude small vans. Vehicle limits, order loads, route distances, consumption and delivery counts in the business examples are illustrative. Use registration documents, manufacturer information, actual invoices, measured vehicle consumption and completed-route records for decisions.
Check capacity before you split the route.
Review the full delivery list, keep compatible stops together and compare each courier's planned distance.