Diesel cost €1.8929 per litre in Bulgaria on 5 October. Euro-super 95 cost €1.6628. The gap was €0.2301 per litre, so diesel carried a 13.8% price premium over petrol in the latest European Commission observation.
A lower consumption can overcome that premium. With petrol at 10.0 l/100 km, a diesel van must reach 8.78 l/100 km to tie on fuel cost per kilometre. The diesel vehicle needs to use 12.2% fewer litres. That is the useful break-even test for an owner with actual vehicle records.
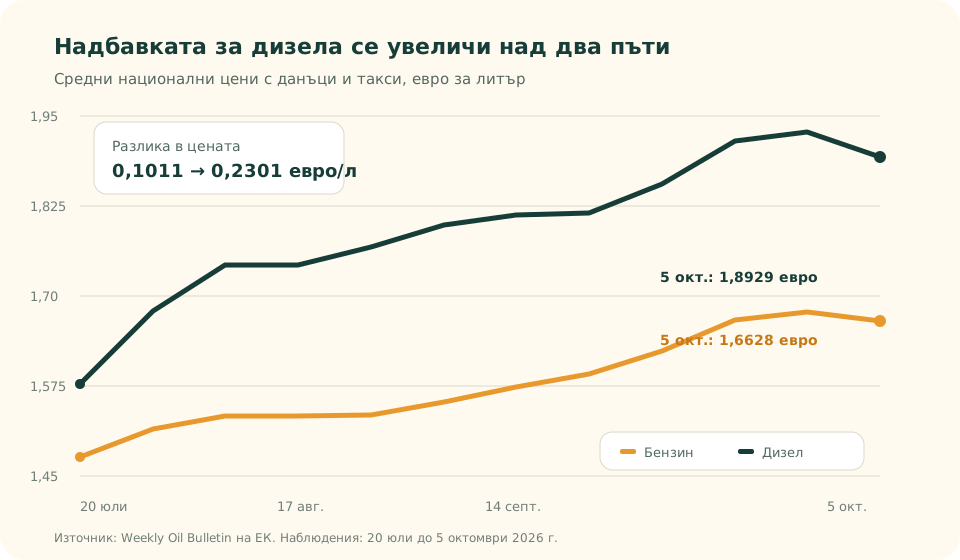
The price gap rose from €0.10 to €0.23 per litre
The Commission's twelve weekly observations from 20 July to 5 October show both fuels becoming more expensive. Petrol rose from €1.4769 to €1.6628 per litre. Diesel rose from €1.5780 to €1.8929. The absolute gap increased from €0.1011 to €0.2301 per litre.
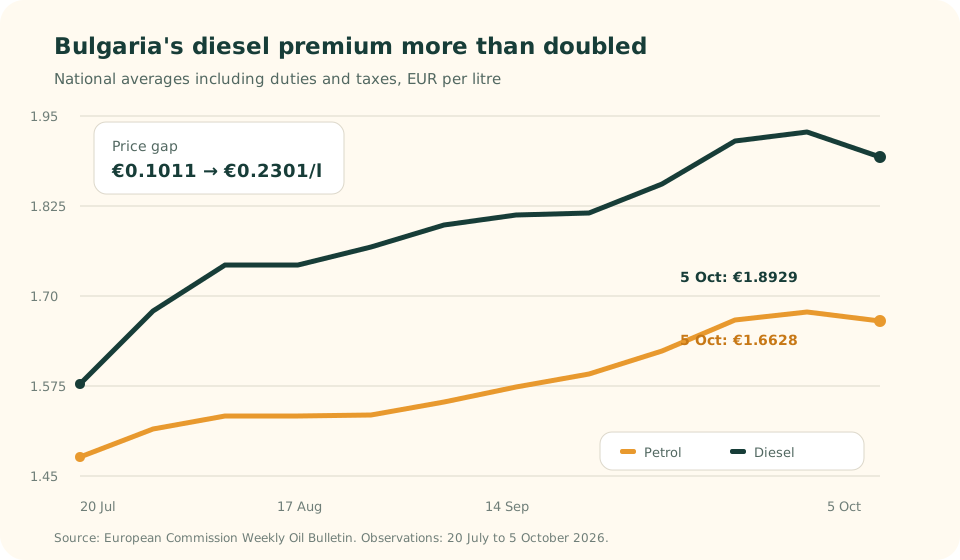
One week cannot settle a vehicle choice, and a national average cannot reproduce a company's discount or location. It can update the value of every planned kilometre today.
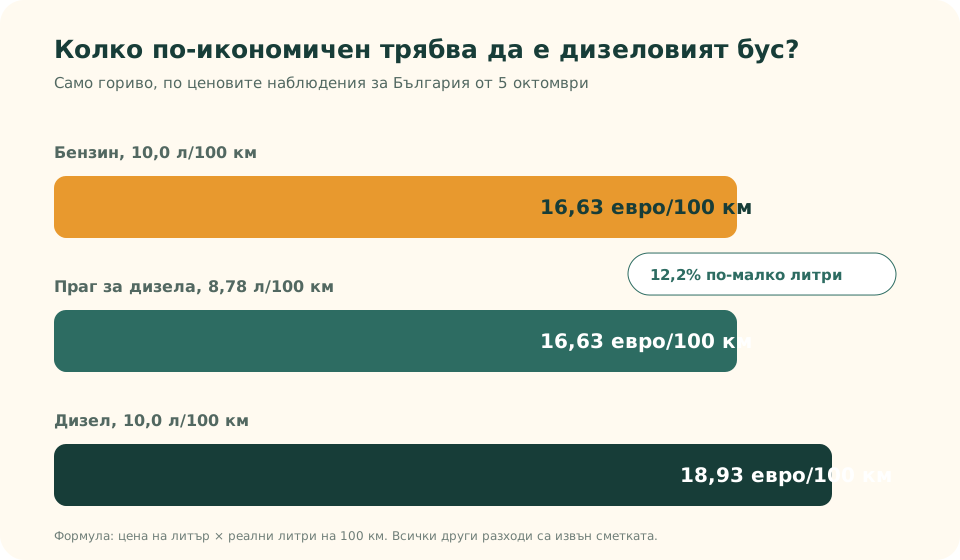
The break-even is 8.78 l/100 km
The calculation has two inputs for each van: price per litre and actual litres per 100 km.
fuel cost per km = price per litre × actual l/100 km ÷ 100
At 10.0 l/100 km, petrol costs €0.16628 per km and diesel costs €0.18929. To match the petrol van, diesel consumption must fall to:
10.0 × €1.6628 ÷ €1.8929 = 8.7844 l/100 km
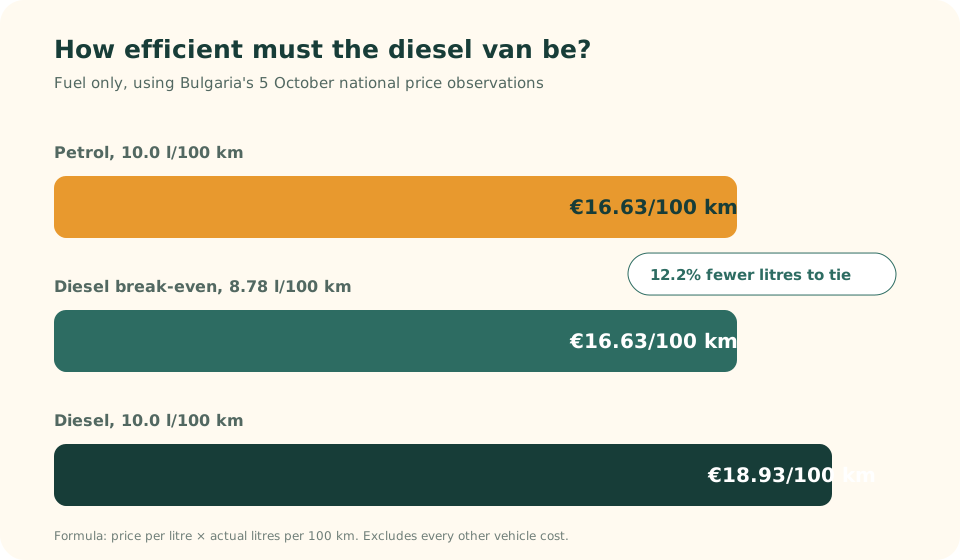
| Illustrative vehicle | Consumption | Fuel per 100 km | Fuel per km |
|---|---|---|---|
| Petrol reference | 10.0 l/100 km | €16.628 | €0.16628 |
| Diesel break-even | 8.7844 l/100 km | €16.628 | €0.16628 |
| Diesel at equal consumption | 10.0 l/100 km | €18.929 | €0.18929 |
Use the van's real consumption
The European Commission's first large report using on-board fuel-consumption data found that the sampled new cars used around 20% more fuel in real driving than their official WLTP values implied. Van coverage was only 1%, so the Commission said the van sample was not representative enough for an assessment.
That limitation strengthens the practical rule. Build the calculation from the vehicle's own operation. For four to eight normal weeks, record fuel added, odometer distance, route type, load pattern and completed deliveries for each van.
actual l/100 km = litres added ÷ kilometres driven × 100
What does one extra kilometre cost today?
At the current price benchmark, the fuel-only answer is 16.6 euro cents for petrol at 10.0 l/100 km. A diesel van using 8.5 l/100 km costs 16.1 cents. A diesel van using 10.0 l/100 km costs 18.9 cents.
If planning genuinely removes 30 kilometres while the same work is completed, direct fuel falls by €4.99 in the petrol example or €4.83 for diesel at 8.5 l/100 km. A kilometre shifted to another van or another day still exists and produces no fleet-wide distance saving.
Route density can matter more than a small efficiency gap
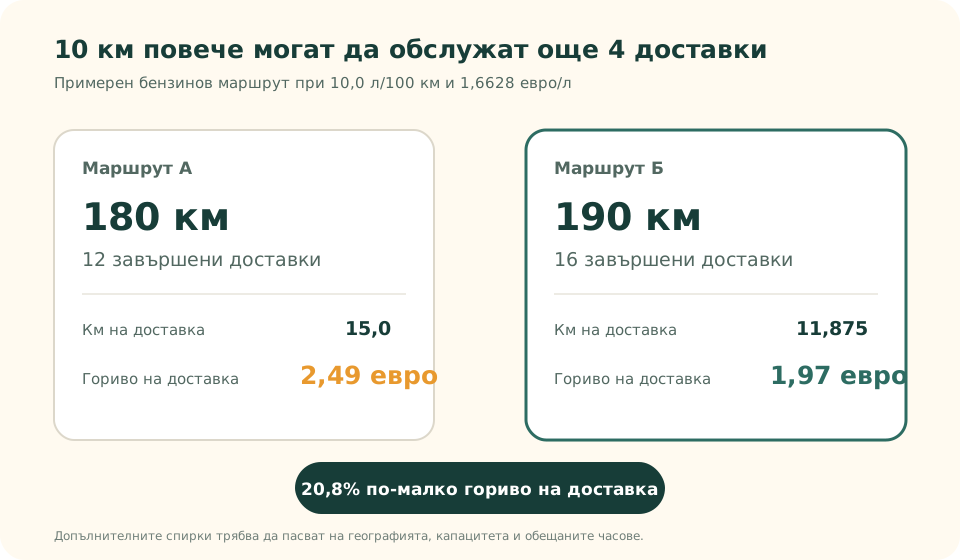
Compare two illustrative petrol routes. Route A drives 180 km and completes 12 deliveries. Direct fuel is €29.93, or €2.49 per completed delivery. Route B drives 190 km and completes 16 compatible deliveries. Direct fuel rises to €31.59, while fuel per completed delivery falls to €1.97.
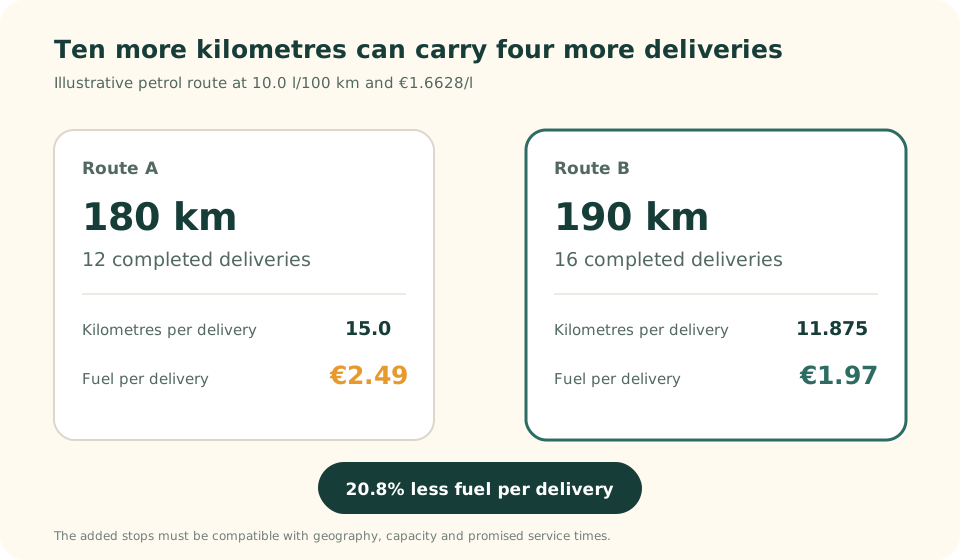
| Illustrative plan | Route A | Route B |
|---|---|---|
| Distance | 180 km | 190 km |
| Completed deliveries | 12 | 16 |
| Kilometres per delivery | 15.0 | 11.875 |
| Direct petrol | €29.93 | €31.59 |
| Fuel per delivery | €2.49 | €1.97 |
The additional stops must fit the geography, vehicle capacity, loading order and promised service times. A distant order can add a branch and reverse the result. The owner needs a route plan before accepting the density gain.
The fuel calculation cannot choose the next van
The 8.78 l/100 km threshold answers one operating question. A purchase decision also needs acquisition price, financing, maintenance, AdBlue where applicable, insurance, vehicle tax, depreciation, resale value, payload, downtime and local access rules. Use the fuel calculation as one auditable line in that wider model.
A weekly six-number check
- Update price per litre. Use the latest invoice for each fuel and keep the Commission average as an external benchmark.
- Calculate actual consumption. Keep each vehicle and route type separate.
- Review planned kilometres. Compare the total before dispatch, including travel from and back to the base.
- Count completed deliveries. Failed and cancelled stops remain visible rather than improving the denominator.
- Track kilometres per completion. This exposes whether denser work is sharing the route.
- Track fuel per completion. Multiply planned or actual distance by the vehicle's fuel cost per kilometre, then divide by completed deliveries.
Where MileCut fits
MileCut starts with the address list the company already uses. Upload Excel or CSV, choose the start and end points, review the addresses and create editable routes for one to five couriers. Team and Control can distribute stops between couriers and let the planner move or reorder them before dispatch.
Use the planned kilometre total to compare valid route options, then apply each van's own fuel cost per kilometre outside the planner. Check whether compatible deliveries can share a route and whether another courier creates overlapping travel from the base. Send the reviewed routes as separate Google Maps links and record actual distance after the day.
If the plan removes genuine distance, the fuel amount above is immediate and auditable. Wider savings in paid time, maintenance or vehicle use belong in the result only when company records show that those costs also fell.
Sources and limits: European Commission Weekly Oil Bulletin, European Commission real-world fuel-consumption report summary, European Commission cars and vans monitoring page. Market data were checked on 9 October 2026. Latest observations are for 5 October. Route and consumption examples are illustrative. Actual prices, vehicles, loads and routes differ.
Price the kilometres before the vans leave.
Upload the next address list, compare route plans and apply the actual fuel cost of each vehicle.